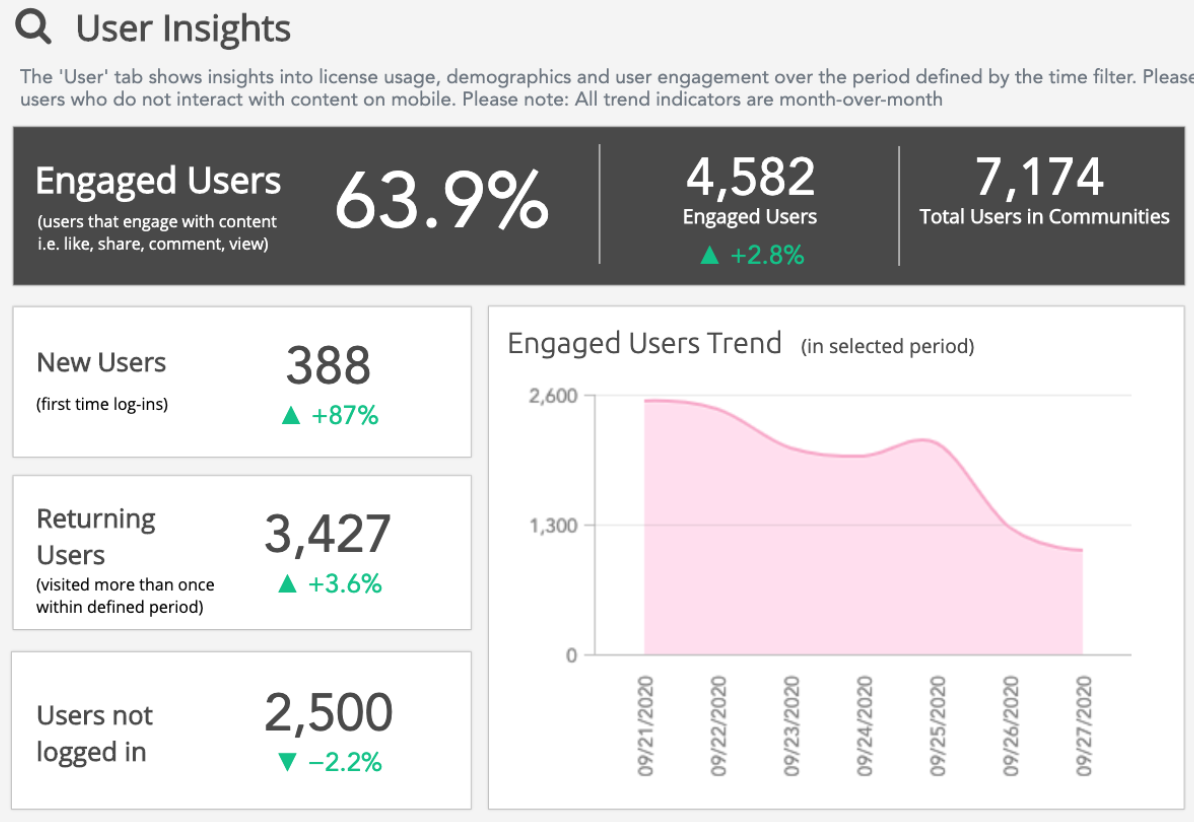
The User insights section in the Engaged Users Overview tab, shows trends and insights related to license usage, user demographics, and user engagement over the period defined in TIME PERIOD filter of the Filter By section.
The following insights are shown:
|
Insight |
|
|---|---|
|
Engaged users
|
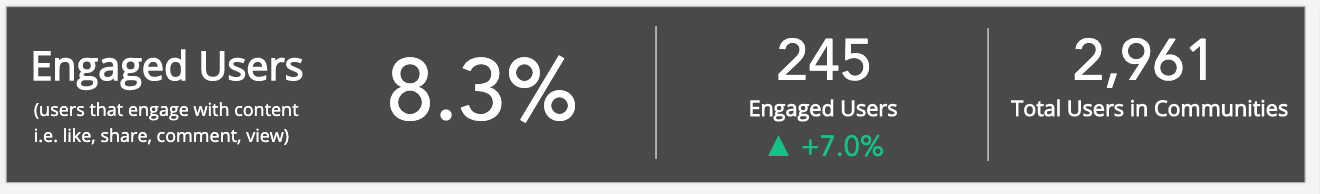
Shows the percentage of engaged users in the Fuse instance, the total number engaged users (and if this number has increased/decreased), and the total number of users in general across communities in the selected time period, specified in the TIME PERIOD filter.
An engaged user is a user who has liked, shared or viewed an item of content.
In the following example: 8.3% of 2,961 users have been engaging with content in the Fuse instance by sharing, liking, and viewing. 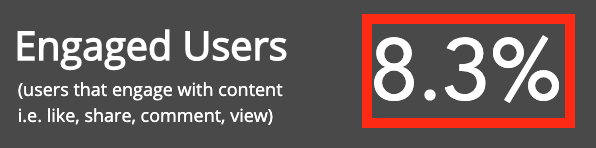
There are 245 engaged users out of 2,961 users in the Fuse instance. This number has increased by 7%, when compared to the same time 30 days prior. 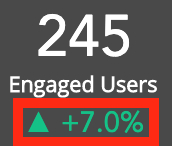
The total number of users across communities is 2,961. 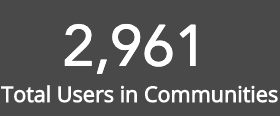
|
|
New Users |
The number of new users in the time period, specified in the TIME PERIOD filter. These are users who have logged in to Fuse for the first time. In the example below, 13 new users have logged in to Fuse during the specified time period. This means the number of new users has decreased by 3.64 when compared to 30 days before. 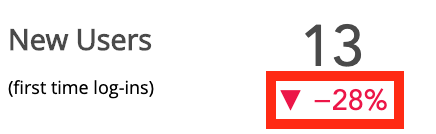
|
|
Returning Users |
The number of users who have engaged with content in the Fuse instance more than once during the specified time period. In the example below, 155 users have engaged with content more than once over the specified time period. This increased by 3.3% when compared to 30 days prior. This means the number of users engaging with content more than once, has increased by 5 users when compared to 30 days before. 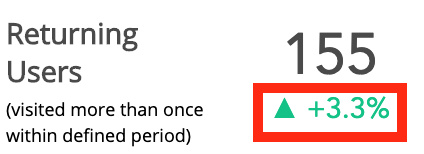
|
|
Users not logged in |
The number of users in the Fuse instance who have not logged in over the selected time period, specified in the TIME PERIOD filter. In the example below, 2,700 users have not logged in to Fuse. This number has decreased by 0.3% when compared to the same time 30 days prior. This means the number of users not logging in has decreased by 8 users, compared to 30 days before. 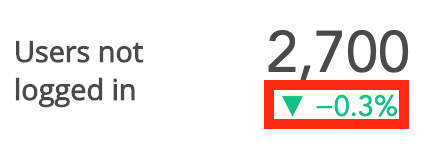
|
|
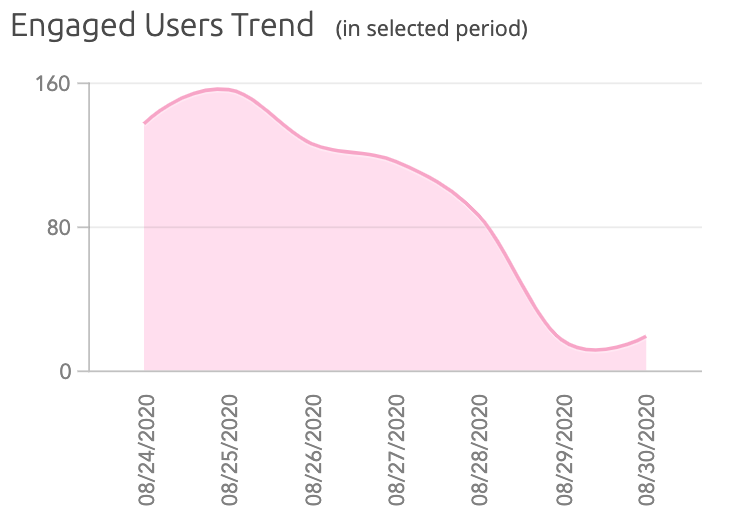
Engaged Users Trend |
Shows the upward/downward trend for engaged users. This is based on time period, specified in the TIME PERIOD filter. In the example below, there has been an overall downward trend in engaged users towards the end of the week. You may see a decrease in engagement at the end of the working week, as users finish tasks and assignments before the weekend begins.
Hover over the line on the graph, to see the numbers for a specific date. 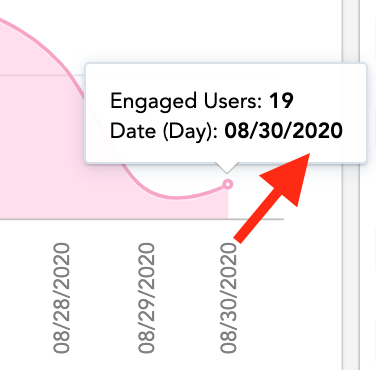
|