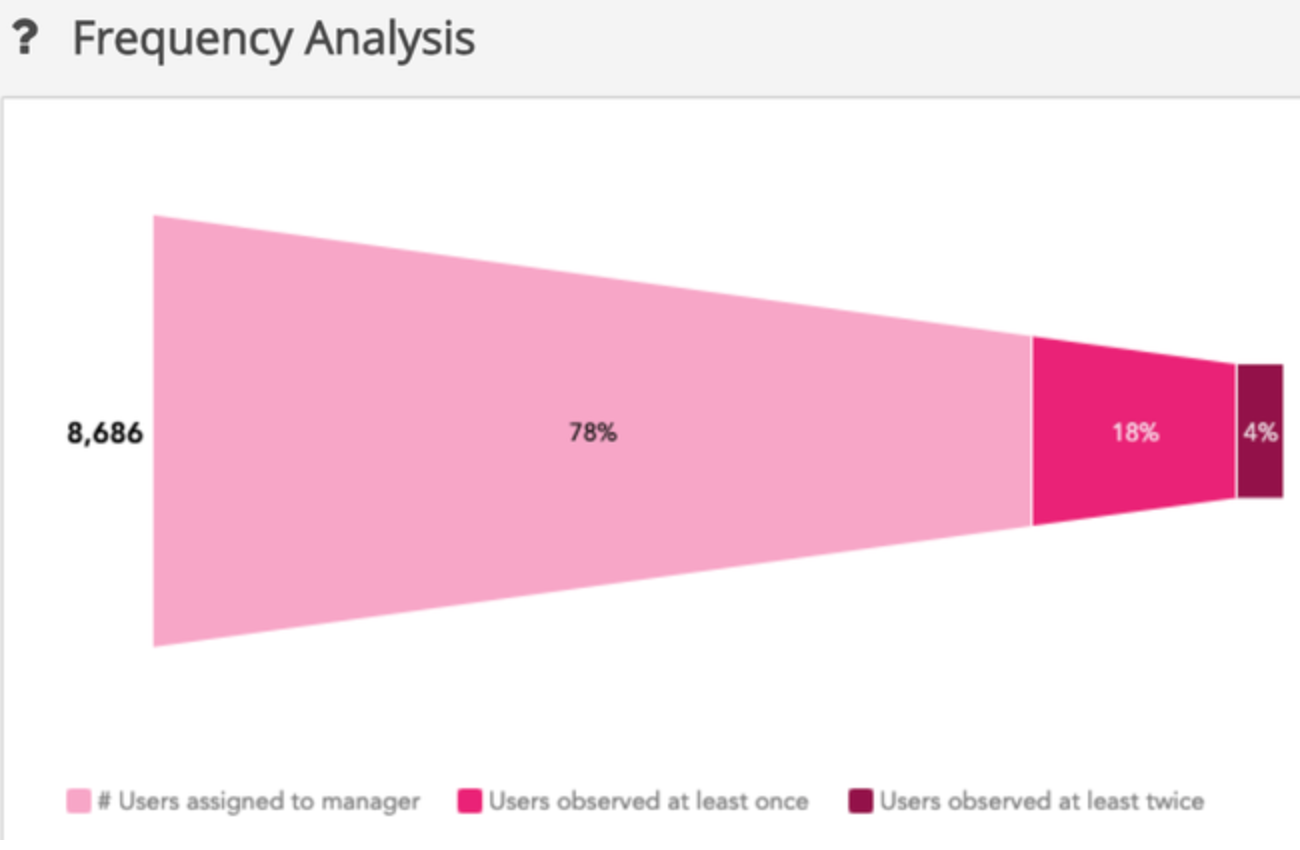
The Frequency Analysis section in the Observations tab, contains a funnel showing how frequently users were being coached in observational assessments over the defined period.
Users who are given regular feedback and coaching via observations perform better at their jobs. Users can take the feedback provided by their manager and gradually incorporate it into their day-to-day.
In the example below:
-
There are 8,686 users in Fuse.
-
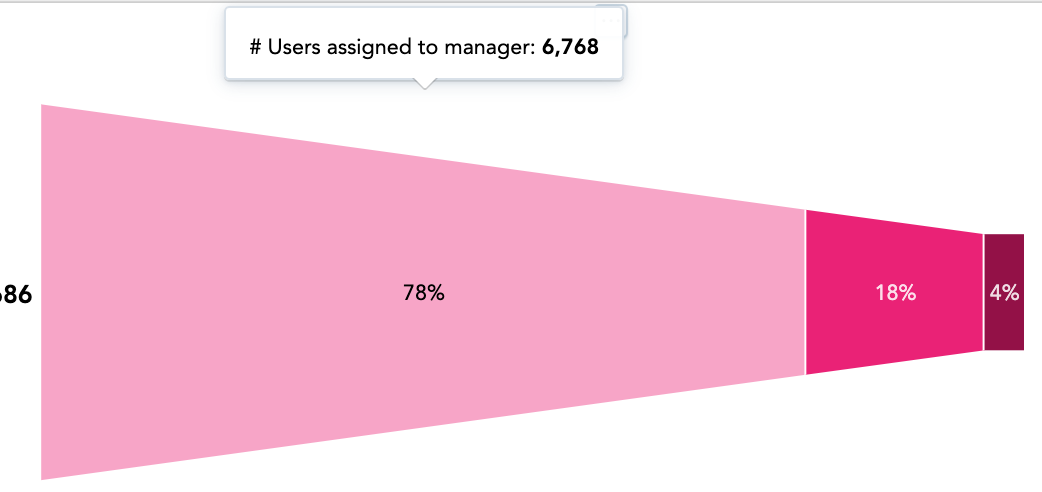
6,768 of those users are assigned to a manager.
-
1,567 out of those 6,768 users assigned to a manager, have been observed at least once over the defined period.
-
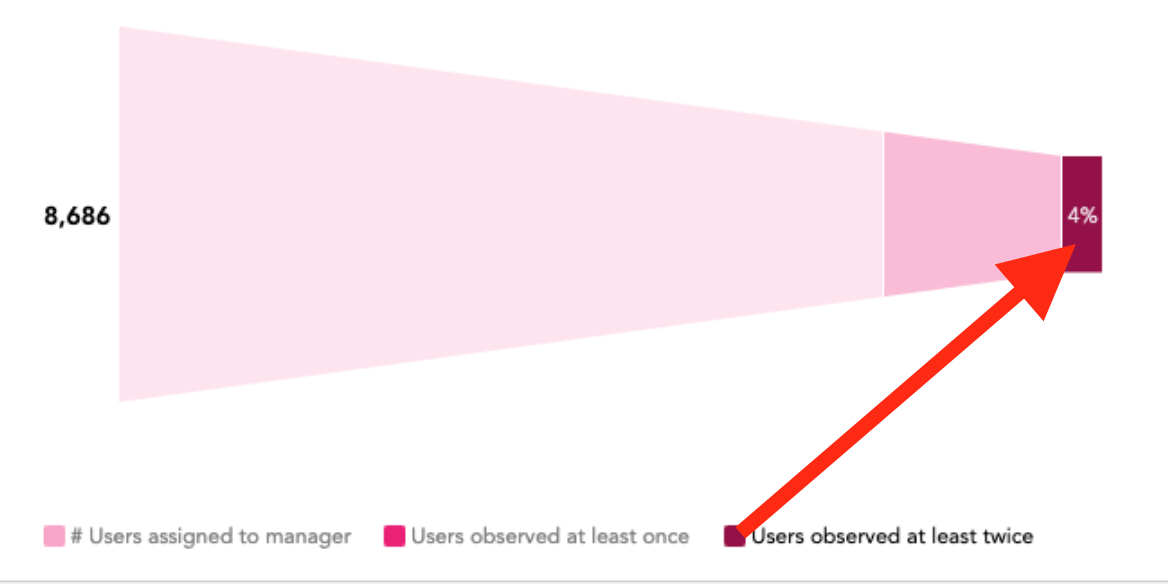
351 users out of those 6,768 users assigned to a manager, have been observed at least twice over the defined period.
This shows that only a very small number of users (4%) were observed regularly over the defined period. This means that the majority of users who were assigned a manager, were not being observed regularly.
You can also see that there are 1,918 users without a manager, which means they cannot be coached via observations.
If reportees do not receive regular feedback from their manager, it will be much harder for them to maximise their performance and progress in their career.
Hover over each portion of the funnel to reveal the number of users.
Hover over each colour in the legend to isolate specific information on the funnel.