
The Universal Analytics dashboard is divided into tabs that appear at the top of the screen. Each tab contains charts, graphs, and insights related to a particular area of Fuse, covering things such as content engagement, learning plan completion, user engagement, content consumption, and event participation in your Fuse instance.
You can also:
-
Filter the data and insights in each tab, so that you only see relevant information.
-
Download reports containing data from each tab as a PDF, CSV or XLSX.
-
Create your own insights using the Analyzer tool.
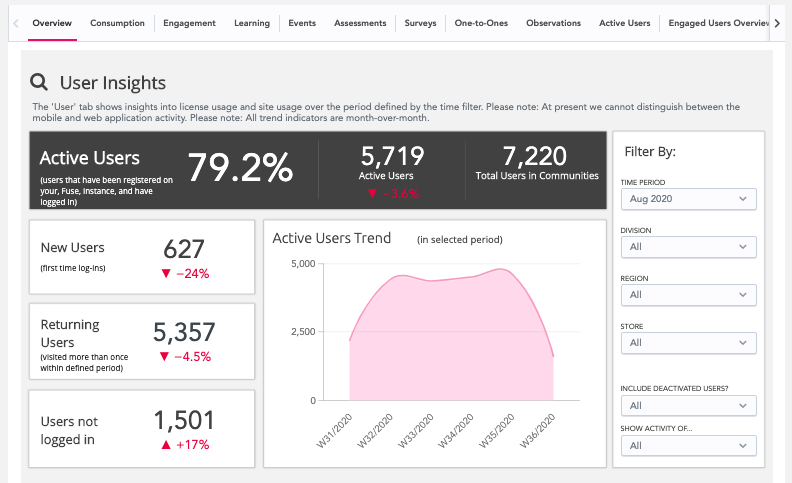
Tabs
The following tabs exist on the Universal Analytics dashboard: