The Content Consumption section in the Consumption tab, shows the view ratio and average number of views for each content type.
Learning plan completions are not included in the data in the Consumption tab. Data related to learning plan completions can be found in the Learning tab.
All trend indicators in the Consumption tab are based on 30 day periods.
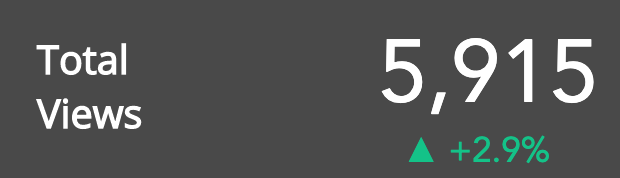
In the example below, the total number of content views has increased by 2.9% when compared to the same time 30 days prior. This means the total number of content views has increased by 1,715 users, when compared to the same time 30 days before.
The following insights are shown:
|
Insight |
Description |
|---|---|
|
Total Views |
The total number of content views, based on the filters selected in the Filter By section. 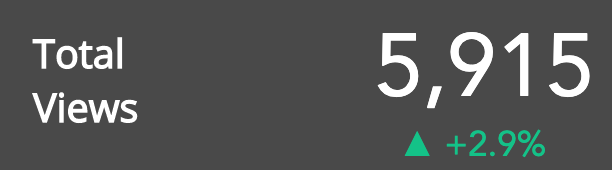
You can also see if this number has increased/decreased, when compared to the same time 30 days prior. In the example below, the total number of content views has increased by 2.9% when compared to the same time 30 days prior. This means the total number of content views has increased by 1,715, when compared to the same time 30 days before. 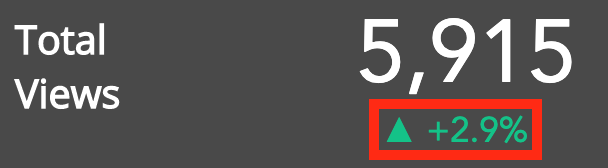
|
|
Total Content Uploaded |
The number of items of content uploaded to Fuse, based on the filters selected in the Filter By section. In the example below, you can see that 1,422 items of content have been uploaded. 
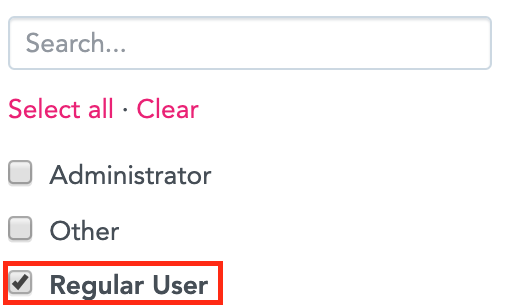
If you wish to see user generated content (UGC), only select the Regular User check box in the Show Activity of... filter in the Filter By section.
In the context of Universal Analytics, items of content include questions, videos, articles, external links, uploaded files, and SCORM courses. |
|
Content View Ratio |
The content view ratio for all content types, based on the filters selected in the Filter By section. In the example below, the most viewed content type is Video, with 30% of the user viewership. 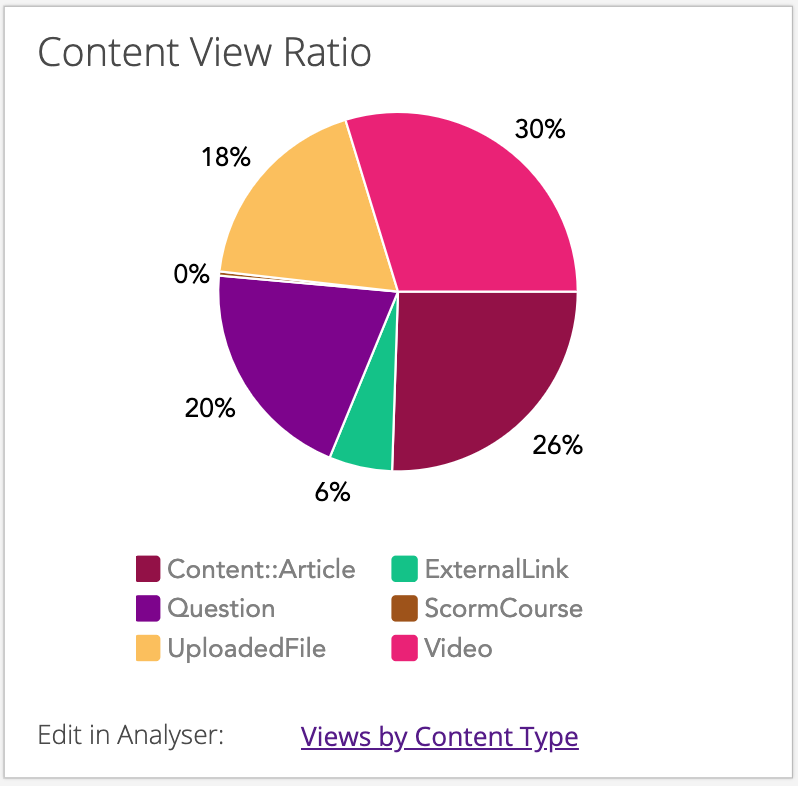
Hover over each content type on the pie chart to view the specific viewer numbers. In the example below, 1,758 users (30%) have viewed videos in the Fuse instance. 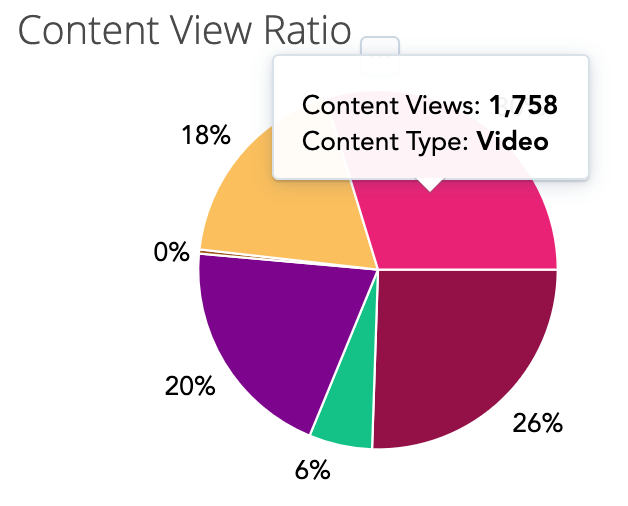
Hover over a specific content type on the legend to highlight it. 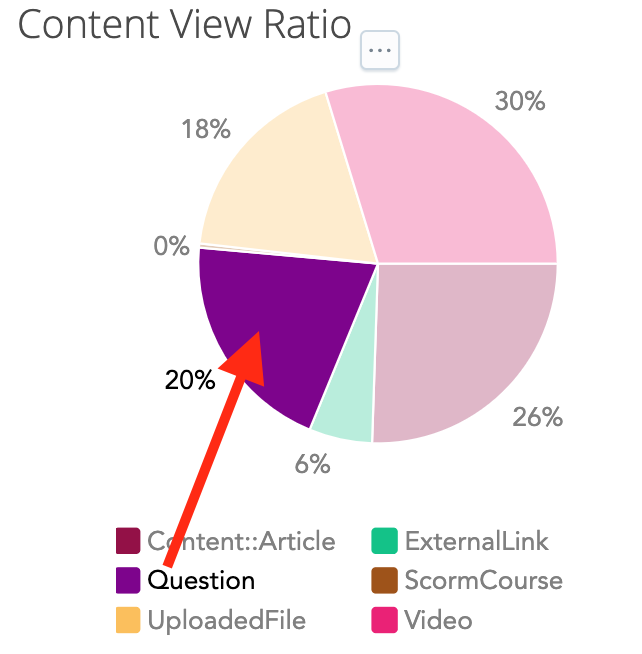
|
|
Average Views by Content Type |
Shows the average number of views for each content type, based on the filters selected in the Filter By section. In the example below:
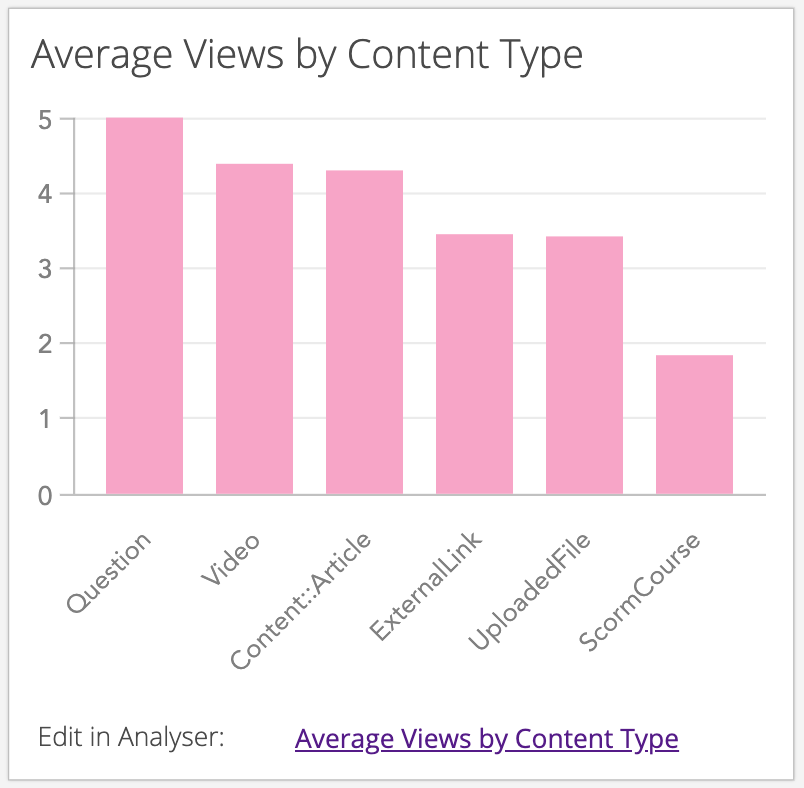
Hover over each bar in the chart to view the specific details. 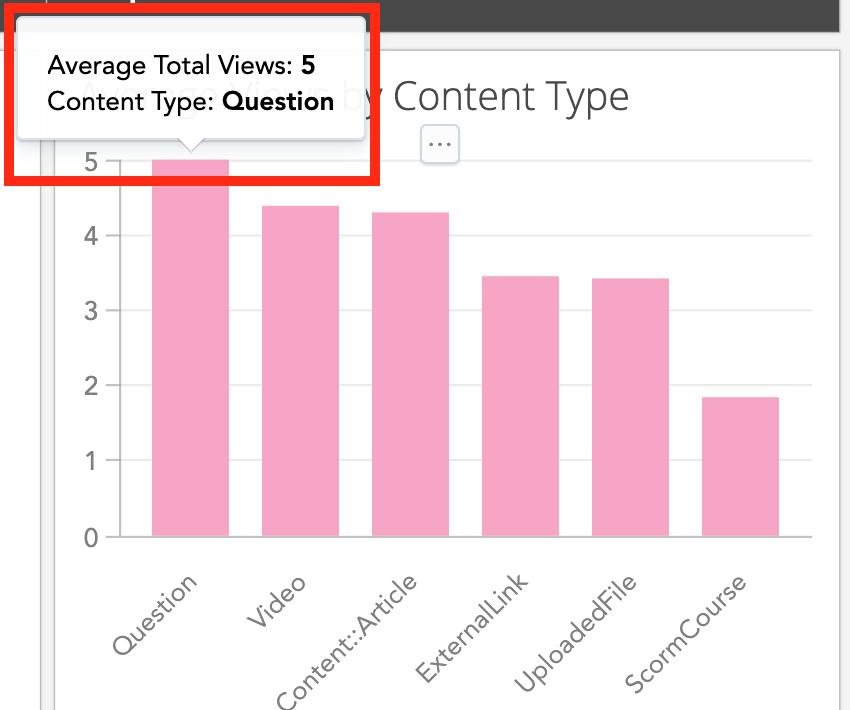
|