
The Content Analysis section in the Consumption tab, shows data and insights on how users consume content in the Fuse instance, including:
-
View data for videos uploaded to Fuse
-
The top 10 most popular (most viewed) items of content.
The following insights are shown:
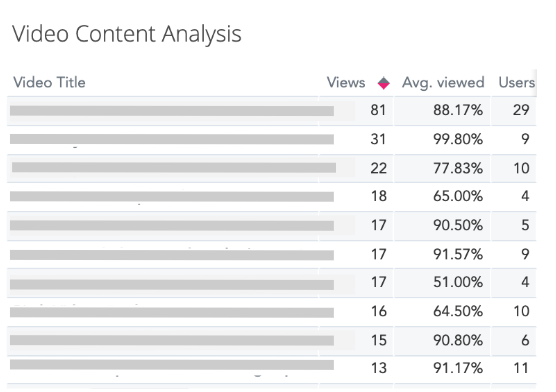
Video Content Analysis
Shows view data for video content in the Fuse instance, including the total number of views, average percentage of the video viewed by users, and the number of users who viewed the video, based on filters selected in the Filter By section.
The following data is shown:
-
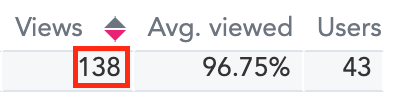
Views: The total number of times the video has been viewed (Either partially or wholly). In the example below, the total number of views for this particular video is 138.
-
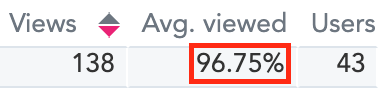
Avg. viewed: How much of the video on average, did users view. In the example below, users in the Fuse instance viewed 96.75% of this video on average.
-
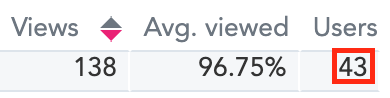
Users: How many users viewed the video (Either partially or wholly). In the example below, 43 users in the Fuse instance viewed this video.
Most Popular Content
Lists the 10 most popular items of content in the Fuse instance, based on filters selected in the Filter By section.
In the context of the Consumption tab, most popular refers to the highest number of views.
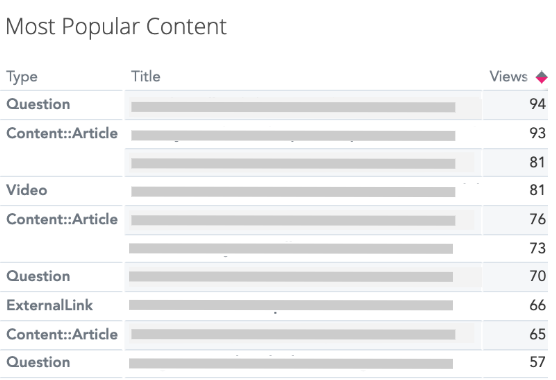
The following information is shown for each item of content in the list:
-
Type: The content type. An item of content can be a video, article, question, uploaded file, external link, or SCORM course.
-
Title: The title of the item of content.
-
Views: The total number of the times the content has been viewed.