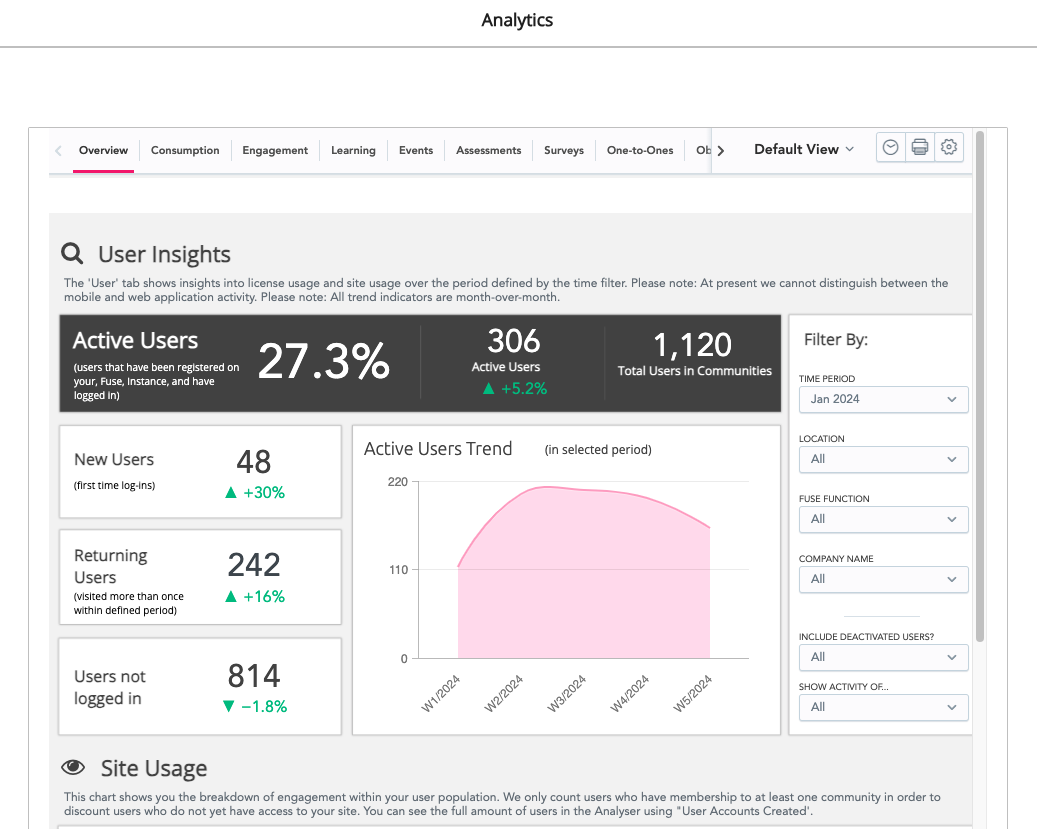
The Analytics screen takes you to the Universal Analytics dashboard, where you can find detailed data and insights related to different areas of your organisation's Fuse instance, such as user engagement, content consumption, learning plan completion, event attendance, survey response rates, one-to-one goal completion, and observational assessments in the form of filterable charts, graphs, and reports. These charts, graphs, and reports can help you spot upward and downward trends, gaps in user knowledge, and help you plan and devise future learning and content strategies so that your organisation gets the most out of Fuse.
Note: On 1st August 2022, the legacy Analytics panel that used to be on this screen and showed page views, content views, and engagement metrics was deprecated, and from now on, you will be taken directly to the Universal Analytics dashboard. This also means the Contributions, Average content score and My activity widgets will also cease to show data when placed on pages such as .
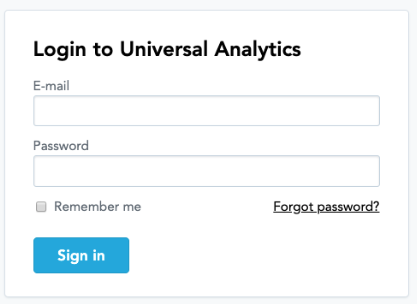
Logging in to Universal Analytics
If you are accessing Universal Analytics for the first time, you will see a login screen after landing on the Analytics screen. For information on how to access Universal Analytics, log in, and reset your password, see Accessing Universal Analytics.