
A month over month trend indicator provides context for the data displayed on the Universal Analytics dashboard and tells you if data, such as user engagement, has increased or decreased when compared to 30 days prior to the selected time period.
You can select a specific time period using the filter on the dashboard, as shown below:
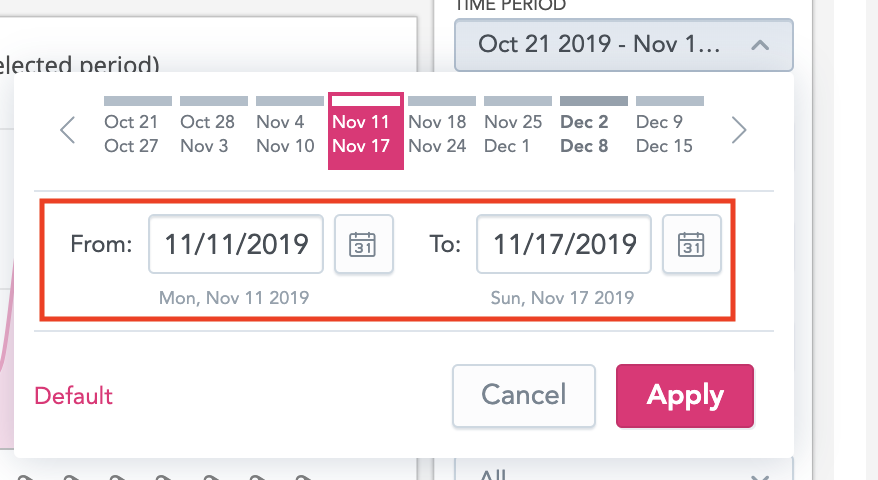
The selected time period remains the same, however, the trend indicator start date is always set 30 days prior to the selected start date on the filter.
Examples:
-
Example 1: If you specify a period of 1 week (1st of May - 7th May) the data used to calculate the trend indicator will be taken from the 1st of April - 7th April (The previous month).
-
Example 2: If you specify a period of 1 month (1st May - 30th May) the data used to calculate the trend indicator will be taken from the 1st of April - 30th April (The previous month).
-
Example 3: If you specify a period of one year (January - December), the data used to calculate the trend indicator will be taken from December of the previous year until the end of November of the current year.
-
The filter is set at 1 week by default.
-
If you close the application and open it again, Universal Analytics will keep the previously selected time period.