
You can drag metrics from the Data Catalogue into the Metrics section of the Analyzer tool.
A metric represents quantitative data. This is numerical data that can be measured. For example, in the One-to-Ones category you can find metrics such as Number of Completed One-to-one Sessions, Number of Commitments, and Number of One-to-one Sessions in Progress.
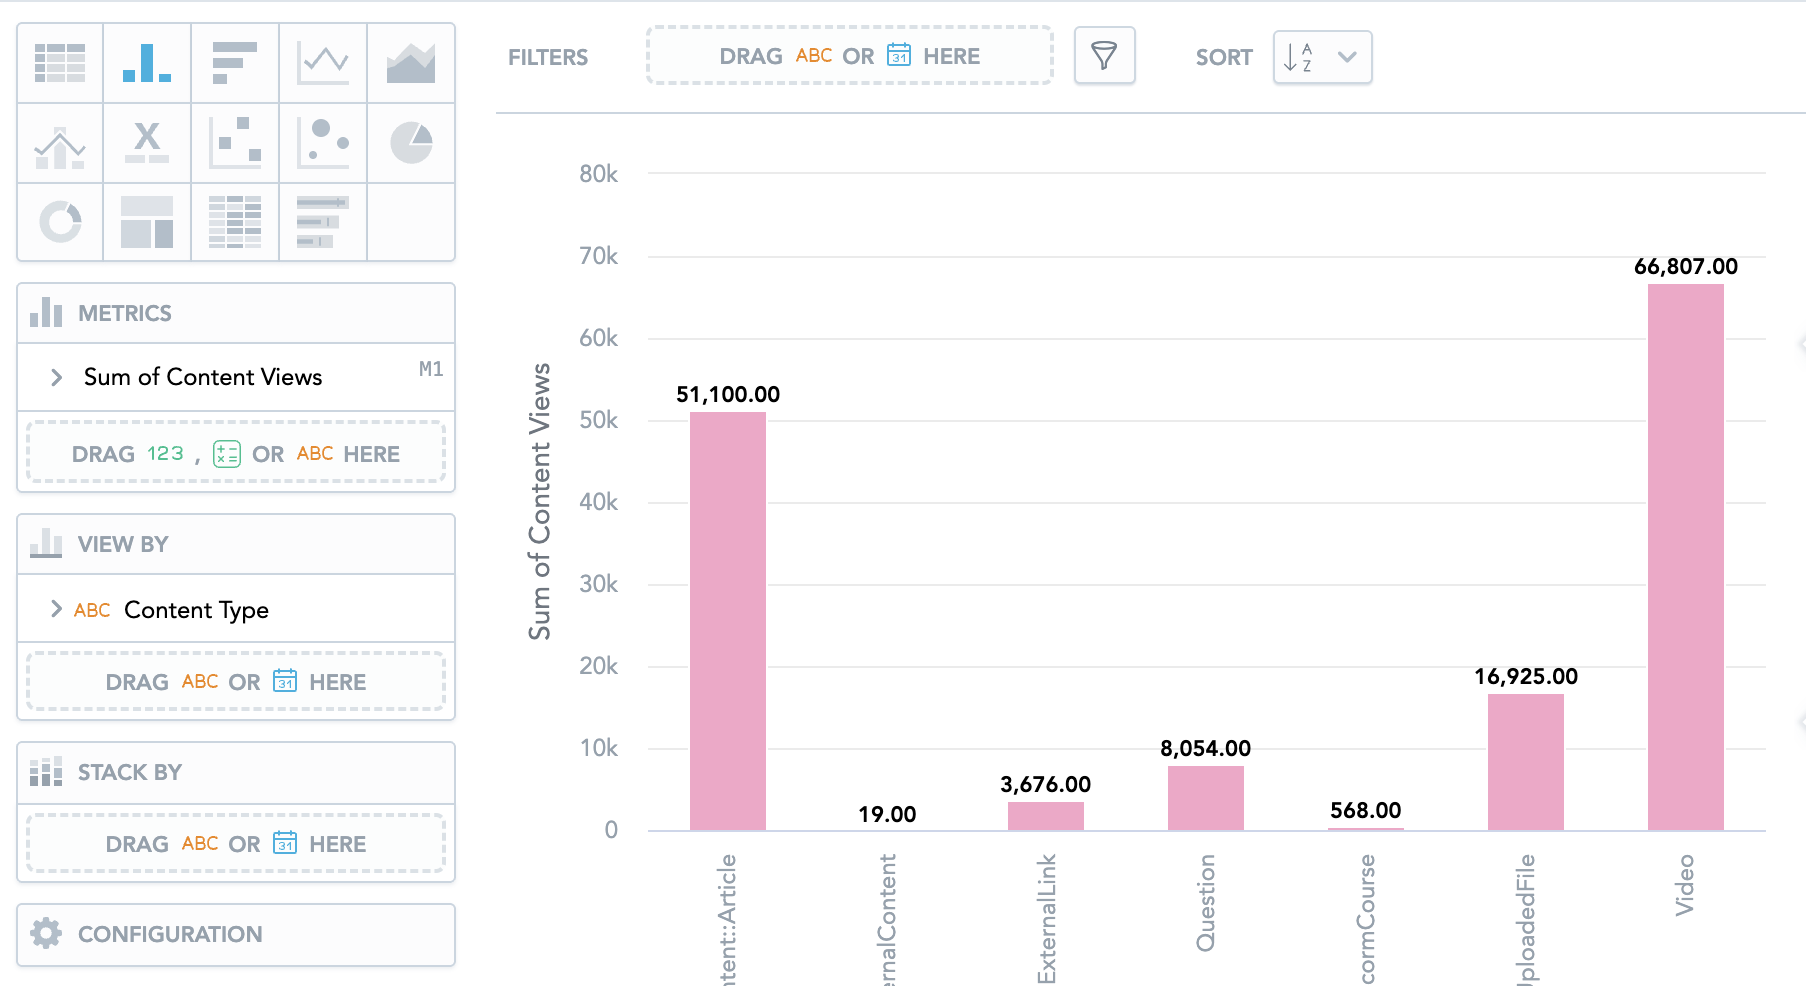
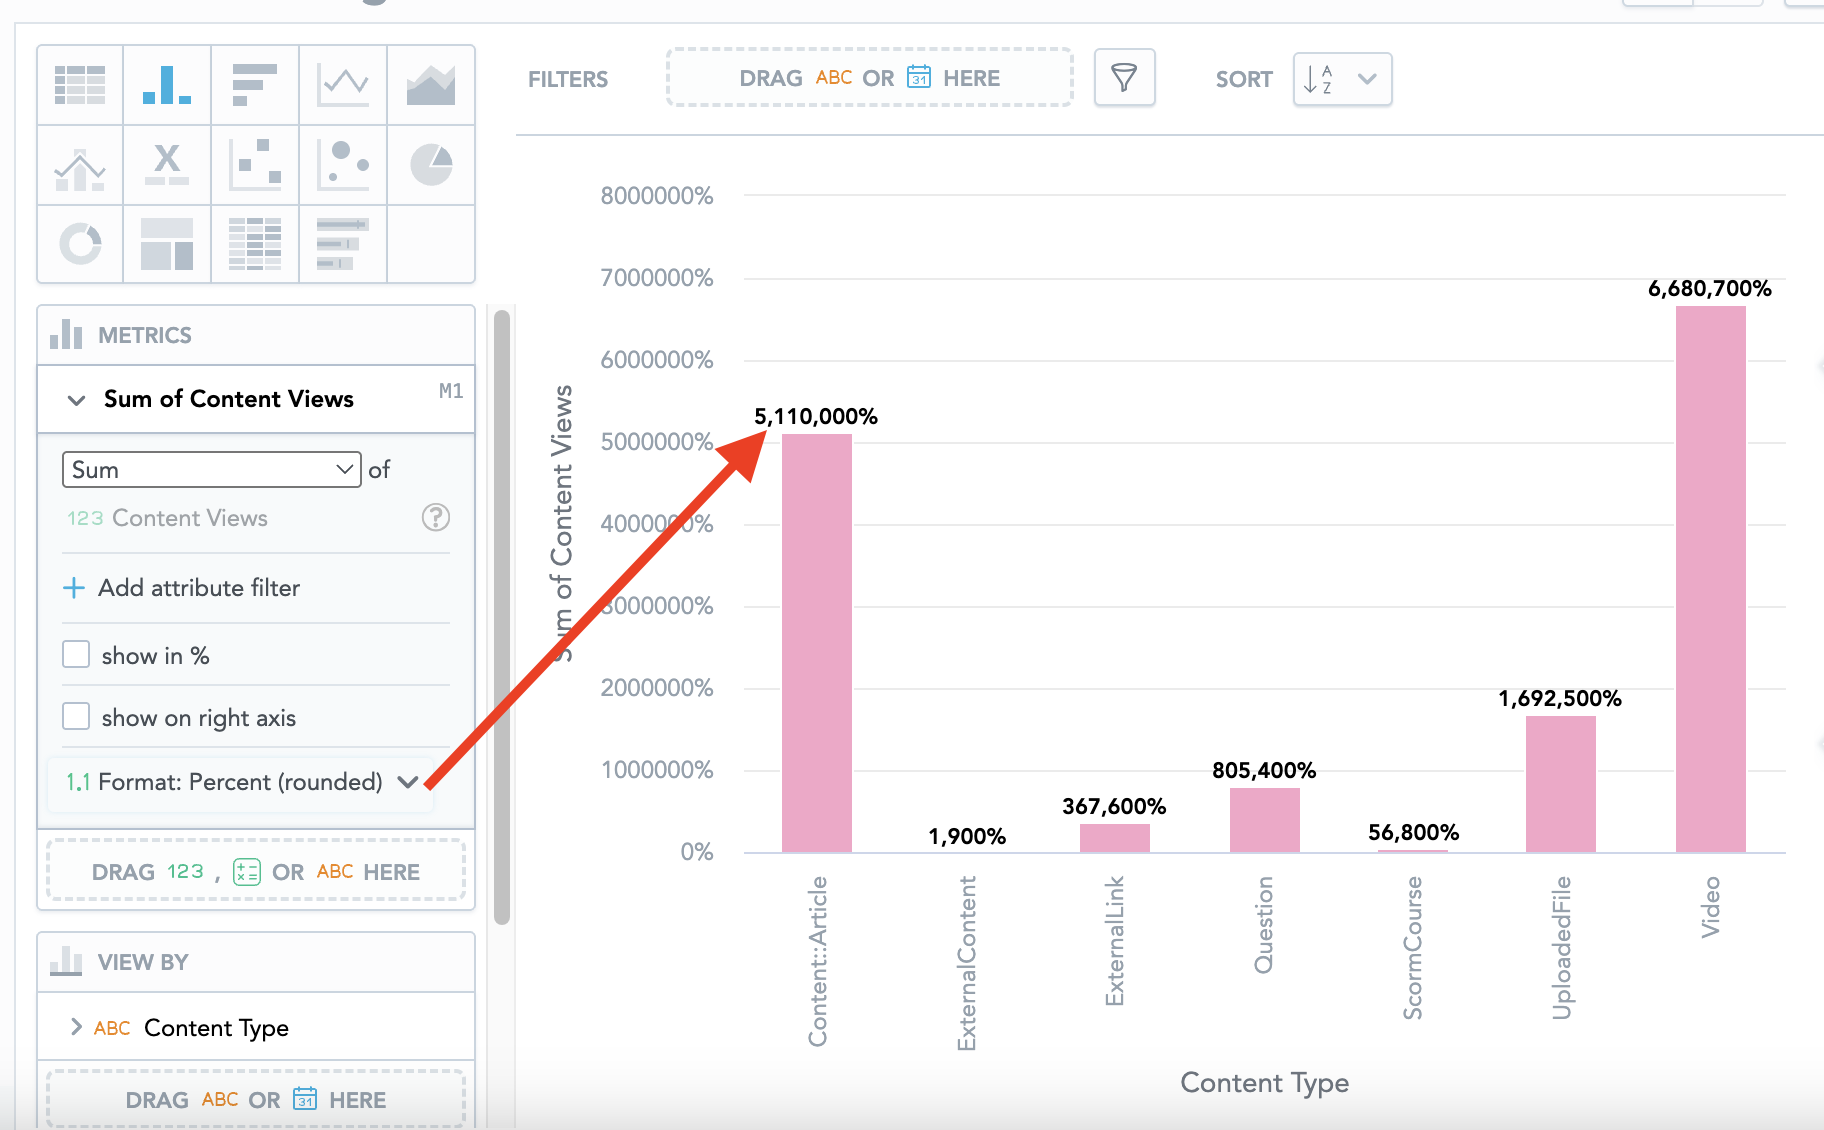
In the example below, the Content Views metric has been dragged into the Metric section. This column chart shows the total number of content views for each type of content in Fuse.
Depending on the insight type you have chosen, the Metrics section allows you to configure and customise the metric you have dragged in.
You can:
-
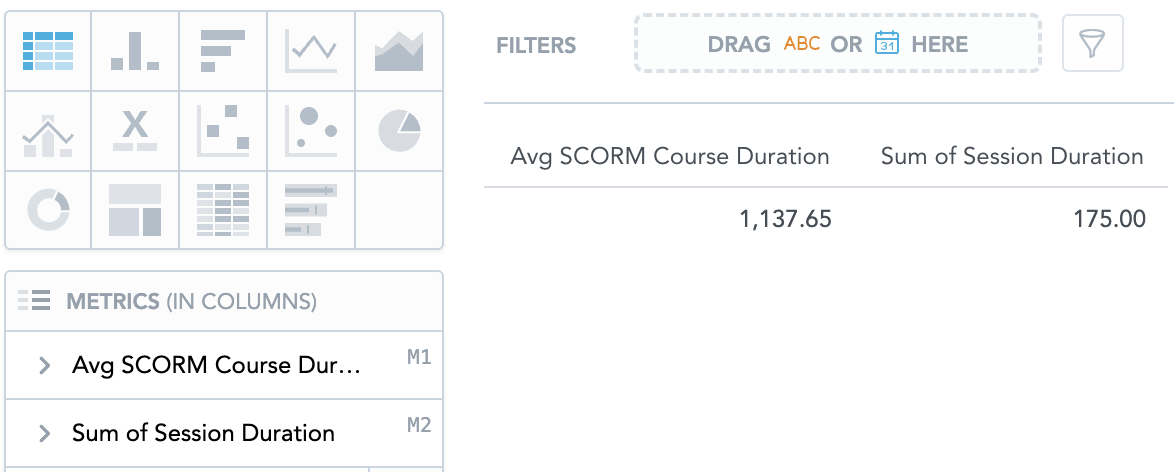
Drag in multiple metrics so that you can compare them. For example, you could drag in the Avg SCORM Course Duration and Session uration metrics, so that you can see them side by side. In the example below, you can see the average amount of time it takes a user to a complete SCORM course in Fuse, alongside the total time it took all users to complete SCORM courses in Fuse.
-
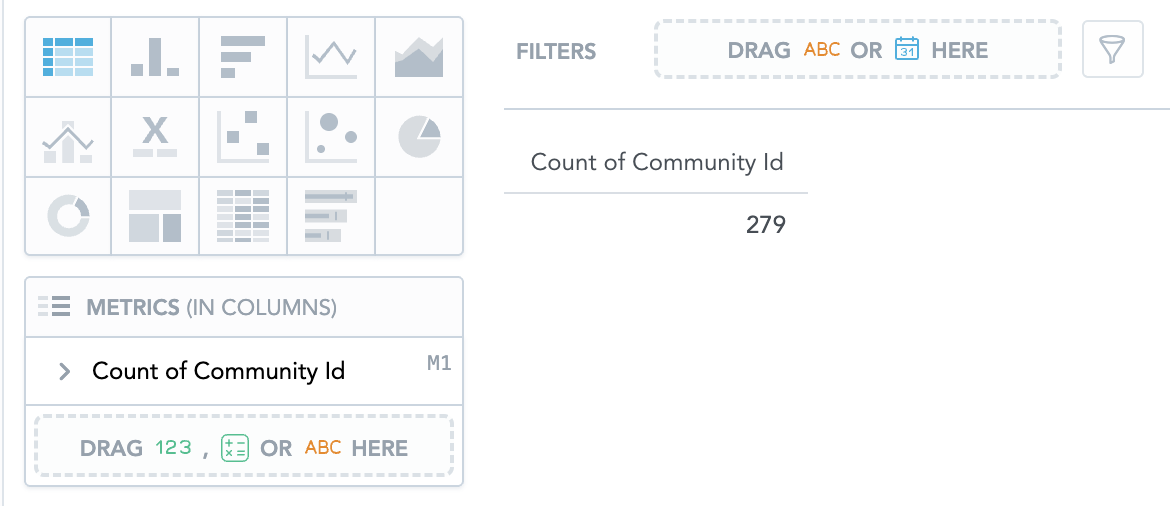
Drag an attribute into the Metrics section. This will result in a count of all values within the attribute. For example, if you want find out how many communities there are on Fuse, you could drag the Community Id attribute into the Metrics section and you will see the number of communities. You can also drag in additional attributes to add extra granularity to an insight.
-
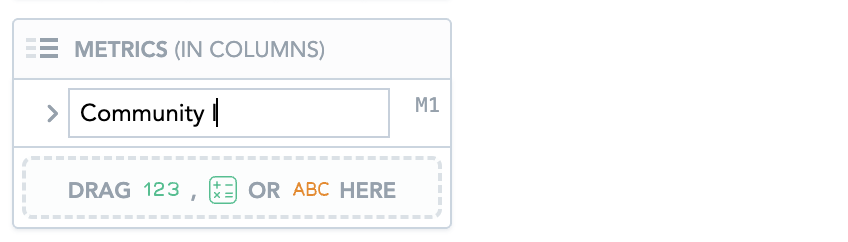
Rename a selected metric.
-
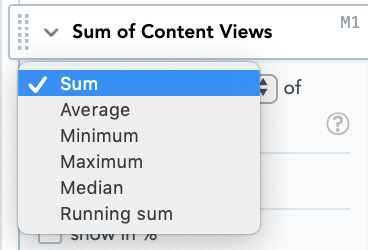
Show the sum, average, minimum, maximum, median, or running sum of the selected metric.
-
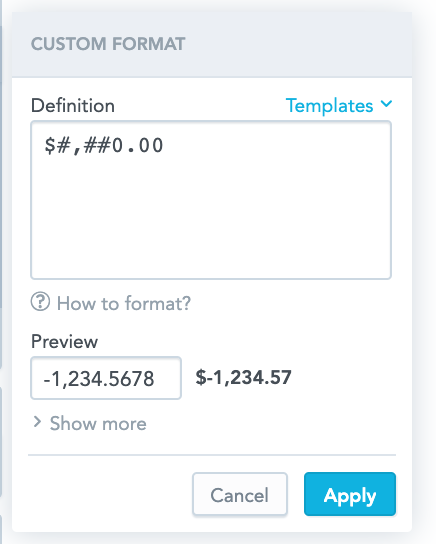
Change the format for a selected metric, using the Format dropdown. You can display the metric as percentage, decimal, rounded number, or create a custom format by entering syntax using the Custom format creation tool. In the example below, the figures on this column chart are displayed as a percentage.
When creating custom formats, you can create a brand new one from scratch by entering syntax, or choose and then modify the syntax of an existing template.
-
Filter the metric by selecting attributes from the Add attribute filter dropdown.
For example, you could filter the Events - Total Seats metric, using the Community Name attribute, so that you only see the total number of seats at events in communities you have selected.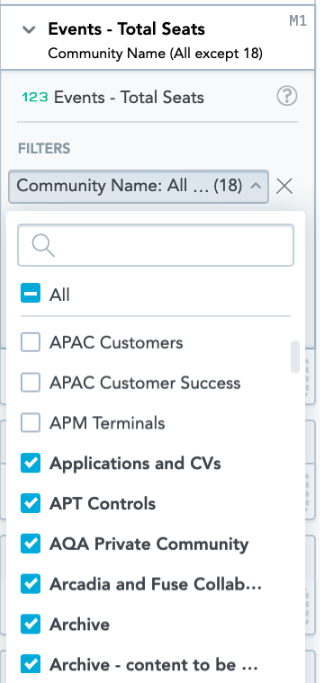
For more information on filtering s, see Filters in the Analyzer tool.