A list of metrics, facts and attributes divided into category folders, such as Content, Event, Engagement, One-to-Ones and so on. These can be dragged and dropped into the respective zones on an insight. Once one of these has been dragged into a zone, it automatically appears on the insight.
For a complete list, see Metrics, facts and attributes.
You can drag and drop:
-
Facts: Facts represent quantitative data. This is numerical data that can be measured. It is important to note that facts are strictly numerical.
-
Metrics: A metric is numerical data that is usually a combination of one or more data points. For example, the Assessment Completion Rate metric provides you with the percentage of users who have completed an assessment out of the users who have access to it, and combines multiple data points in a formula to achieve this, as shown here: SELECT (SELECT COUNT(User Id, Records of Assessment Stats) WHERE Completed Attempts > 0) / Topic Audience.
-
Attributes: Attributes represent qualitative data that cannot be measured, such as descriptions, names, IDs, and statuses. Attributes can be numerical or non-numerical, however, the numerical data is treated as text.
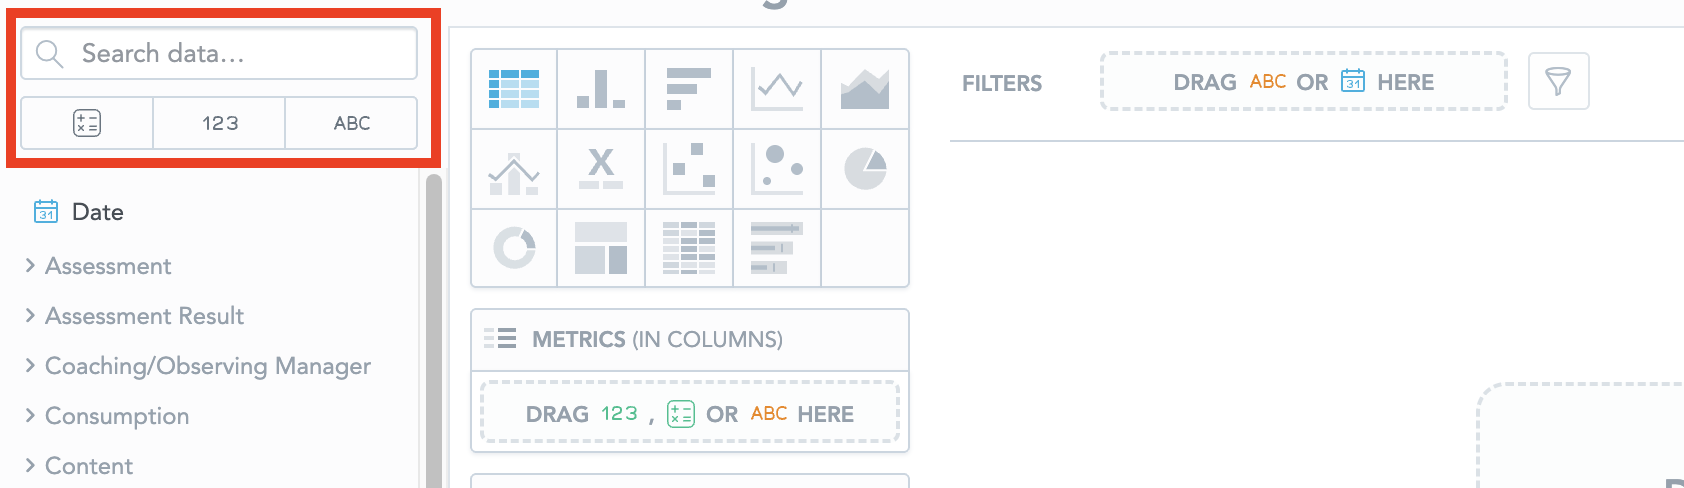
You can search for a particular one using the search bar, as well as filter the catalogue to only show facts, metrics, or attributes using the tabs:
Renaming an attribute, metric or fact
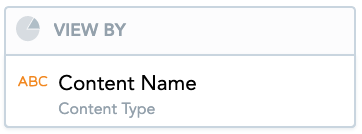
Once you have dragged an attribute, fact or metric into an insight, you can rename it to make it easier for users to understand when viewing it on the insight. For example, you might change the Content Title attribute to "Content Name" instead.
The original name of the insight in the Data Catalogue will not change.
To rename a metric, attribute or fact:
-
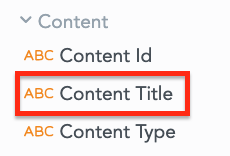
Locate it in the Data Catalogue. For example, Content Title.
-
Drag it from the Data Catalogue to the appropriate section on your insight.
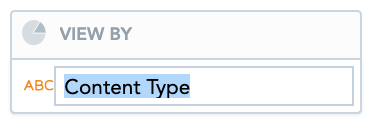
-
Click the name and a text box appears.
-
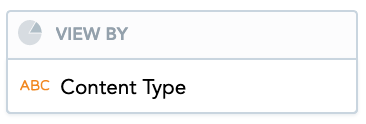
Enter a new name.
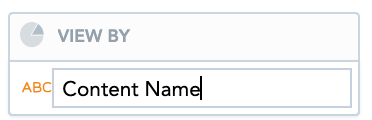
-
Click outside the text box and the new name is saved.