
The Insight types section in the Analyzer tool, allows you to choose how you would like to visualise your insight. You can choose from a variety of insight types, including charts, graphs, and tables.
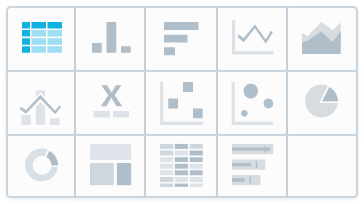
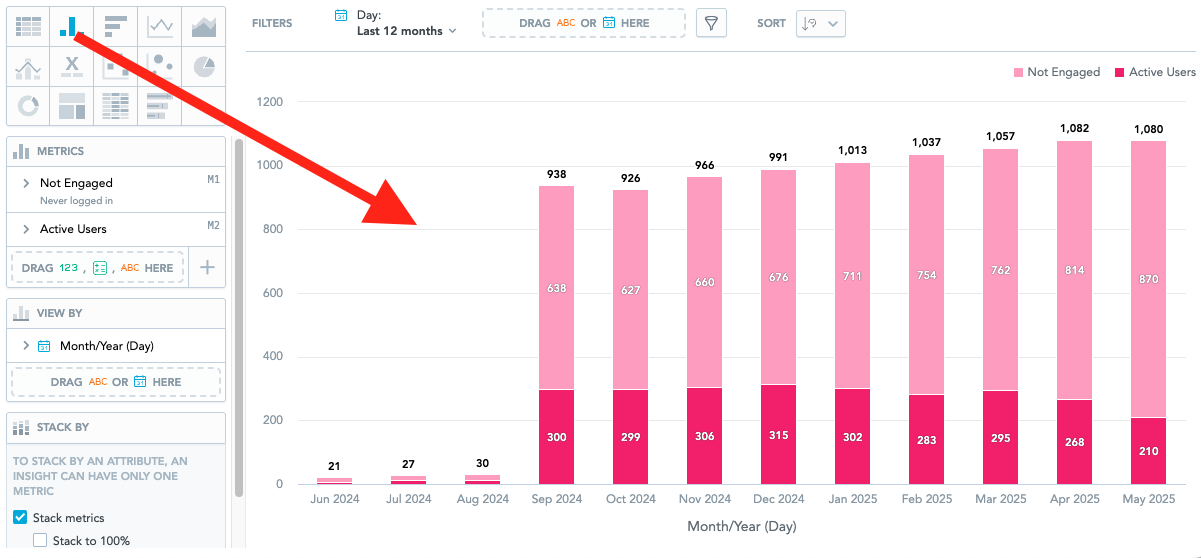
For example, if you select Column chart, the selected metrics and attributes will be displayed as a column chart.
You can do the following for each insight type in Universal Analytics:
-
Build your insights by dragging in metrics, facts and attributes from the data catalogue
-
Filter metrics, facts and attributes by date, so that the data is from specific time periods, as well as drag attributes into the Filters section, so that you can filter data by attribute.
-
Rename the metrics, facts and attributes when you have dragged them into your insight, to make them easier to digest.
-
Customise the look and feel (With the exception of Headline and Table).
The table below provides an overview of the features available for each insight type in Universal Analytics. For more detailed information on each insight type, click the links in the Type column.
Scroll or click the expand icon to view all the columns in this table:
|
Type |
Metrics |
View by |
Stack by |
Attributes |
Trend by |
Segment by |
Rows |
Columns |
Configuration |
Location |
Recommended use case |
|---|---|---|---|---|---|---|---|---|---|---|---|
|
✓
|
✗ |
✗ |
✗ |
✗ |
✗ |
✓ |
✓ |
✗ |
✗ |
Ranking order |
|
|
✓ |
✓ |
✓ |
✗ |
✗ |
✗ |
✗ |
✗ |
✓ |
✗ |
Identifying trends |
|
|
✓ |
✓ |
✓ |
✗ |
✗ |
✗ |
✗ |
✗ |
✓ |
✗ |
Comparison |
|
|
✓ |
✗ |
✗ |
✗ |
✓ |
✓ |
✗ |
✗ |
✓ |
✗ |
Identifying trends |
|
|
✓ |
✓ |
✓ |
✗ |
✗ |
✗ |
✗ |
✗ |
✓ |
✗ |
Identifying trends |
|
|
✓ |
✓ |
✗ |
✗ |
✗ |
✗ |
✗ |
✗ |
✓ |
✗ |
Identifying trends |
|
|
✓ |
✗ |
✗ |
✗ |
✗ |
✗ |
✗ |
✗ |
✗ |
✗ |
Comparison |
|
|
✓ |
✗ |
✗ |
✓ |
✗ |
✗ |
✗ |
✗ |
✓ |
✗ |
Identifying relationships |
|
|
✓ |
✓ |
✗ |
✓ |
✗ |
✗ |
✗ |
✗ |
✓ |
✗ |
Identifying relationships |
|
|
✓ |
✓ |
✗ |
✗ |
✗ |
✗ |
✗ |
✗ |
✓ |
✗ |
Comparison |
|
|
✓ |
✓ |
✗ |
✗ |
✗ |
✗ |
✗ |
✗ |
✓ |
✗ |
Comparison |
|
|
✓ |
✓ |
✗ |
✗ |
✗ |
✓ |
✗ |
✗ |
✓ |
✗ |
|
|
|
✓ |
✗ |
✗ |
✗ |
✗ |
✗ |
✓ |
✓ |
✓ |
✗ |
|
|
|
✓ |
✓ |
✗ |
✗ |
✗ |
✗ |
✗ |
✗ |
✓ |
✗ |
Comparison |