Depending on the insight type, you can customise certain parts of the canvas, including:
-
Showing and hiding labels
-
Showing and hiding gridlines
-
Showing or hiding data points on Stacked Area, Line, and Combo chart types.
The following customisations can be made:
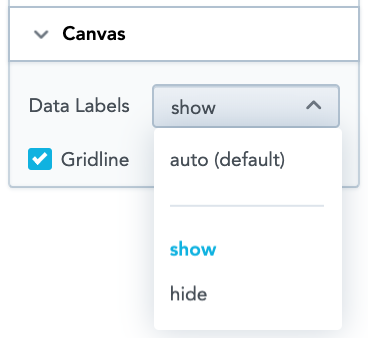
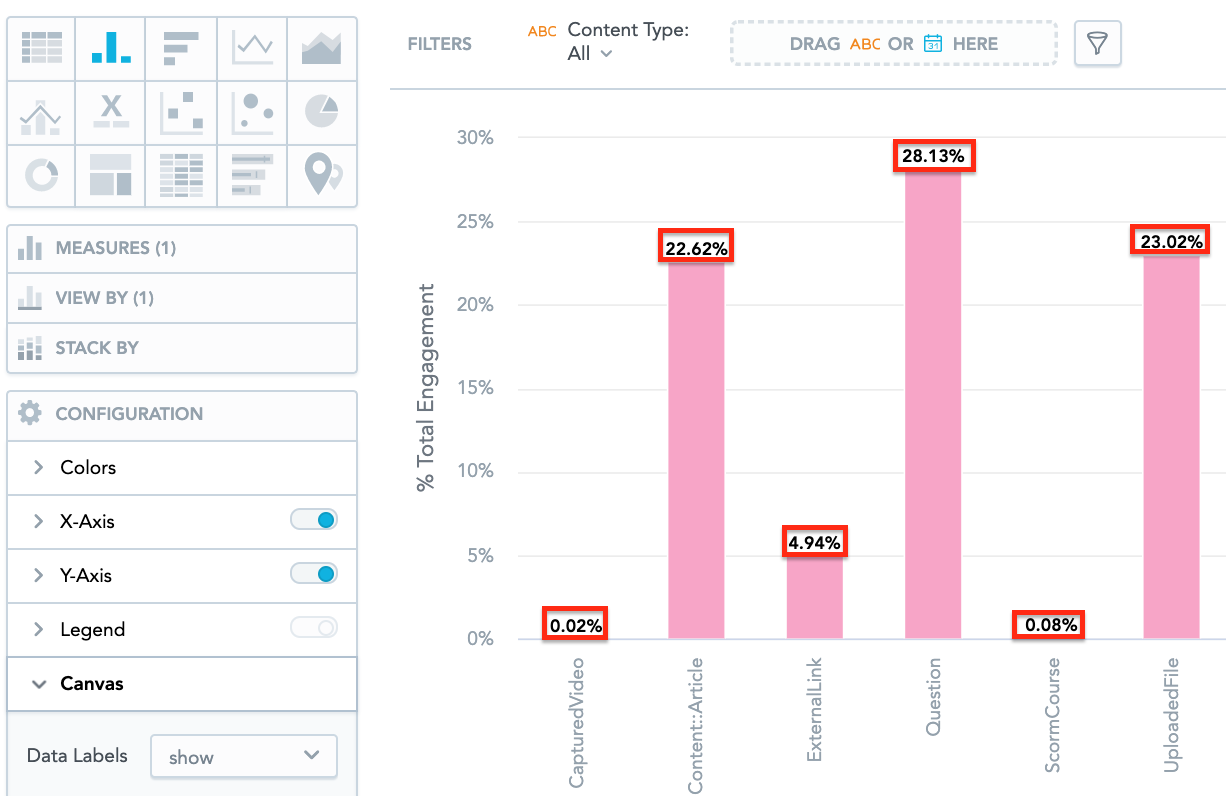
Showing/hiding labels
You can show and hide data labels that appear on certain parts of an insight, using the Data Labels dropdown.
In the example below, the show option is selected, which means the data label for each column in this column chart is visible.
Showing/hiding gridlines
You can show or hide gridlines that appear in the background on an insight, using the Gridline checkbox.
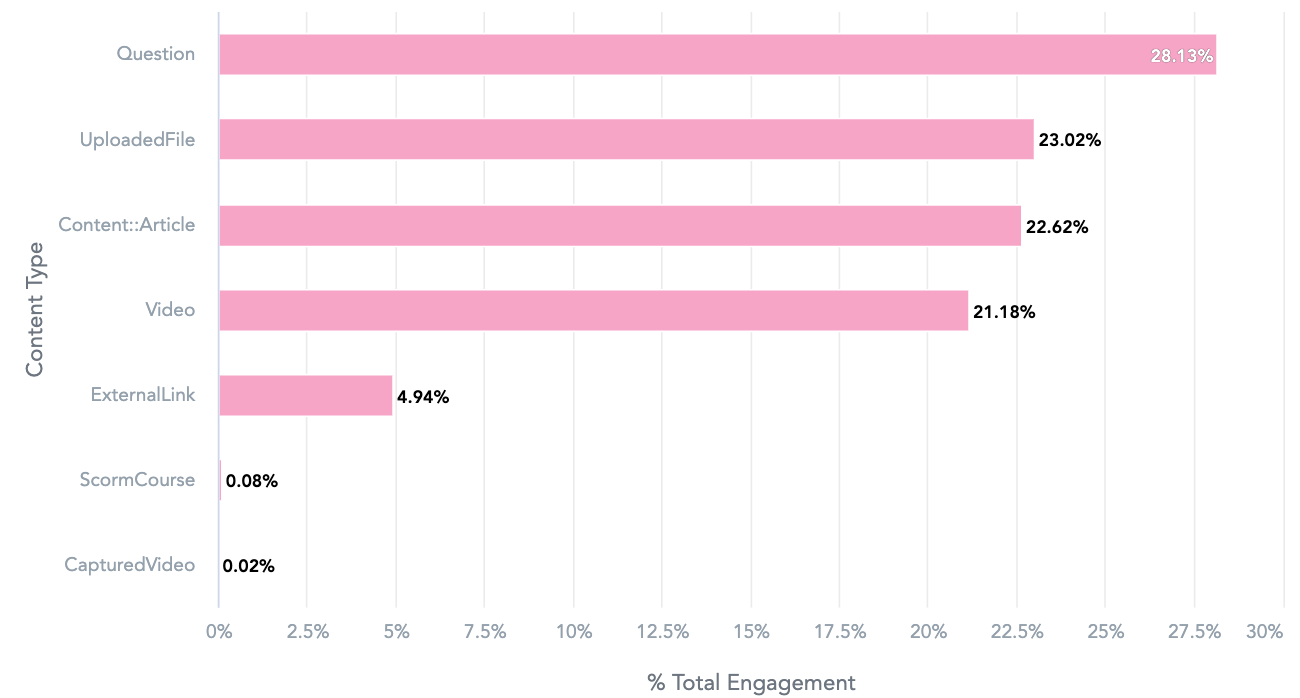
In the example below, the Gridline checkbox is selected, which means the gridlines in the background of this bar chart are visible.
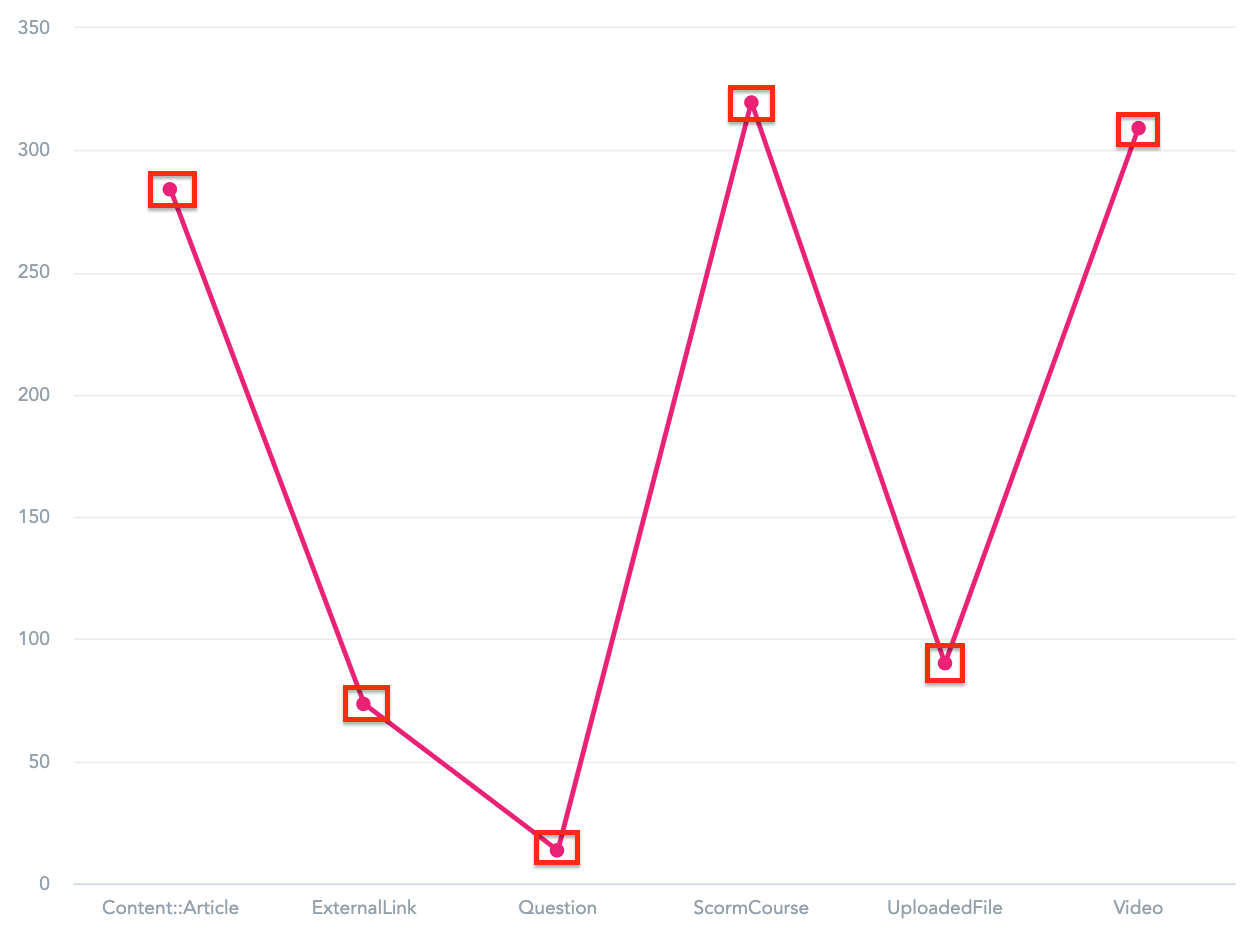
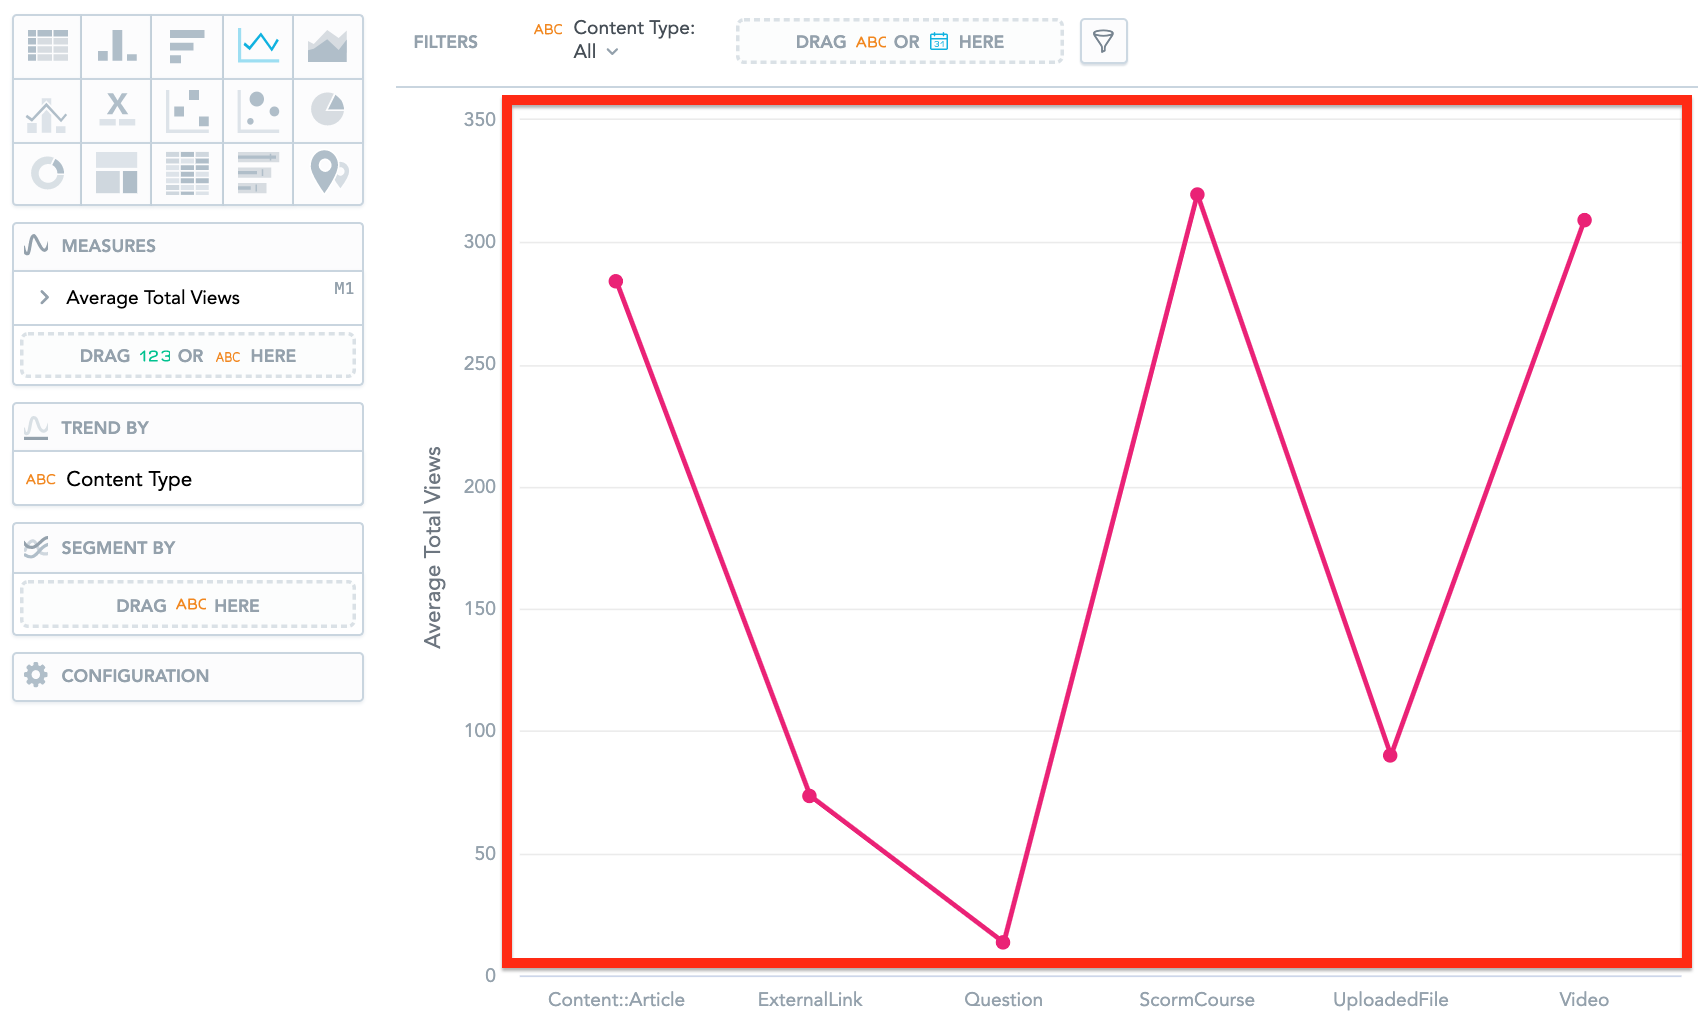
Showing and hiding data points
You can show/hide data points on stacked area chart, line chart, and combo chart insight types, using the Data Points dropdown.
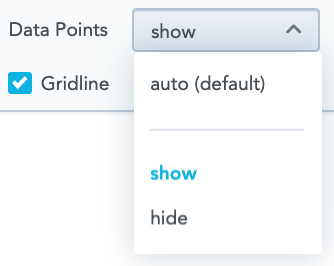
In the example below, show is selected, which means the data points on this line chart are visible.