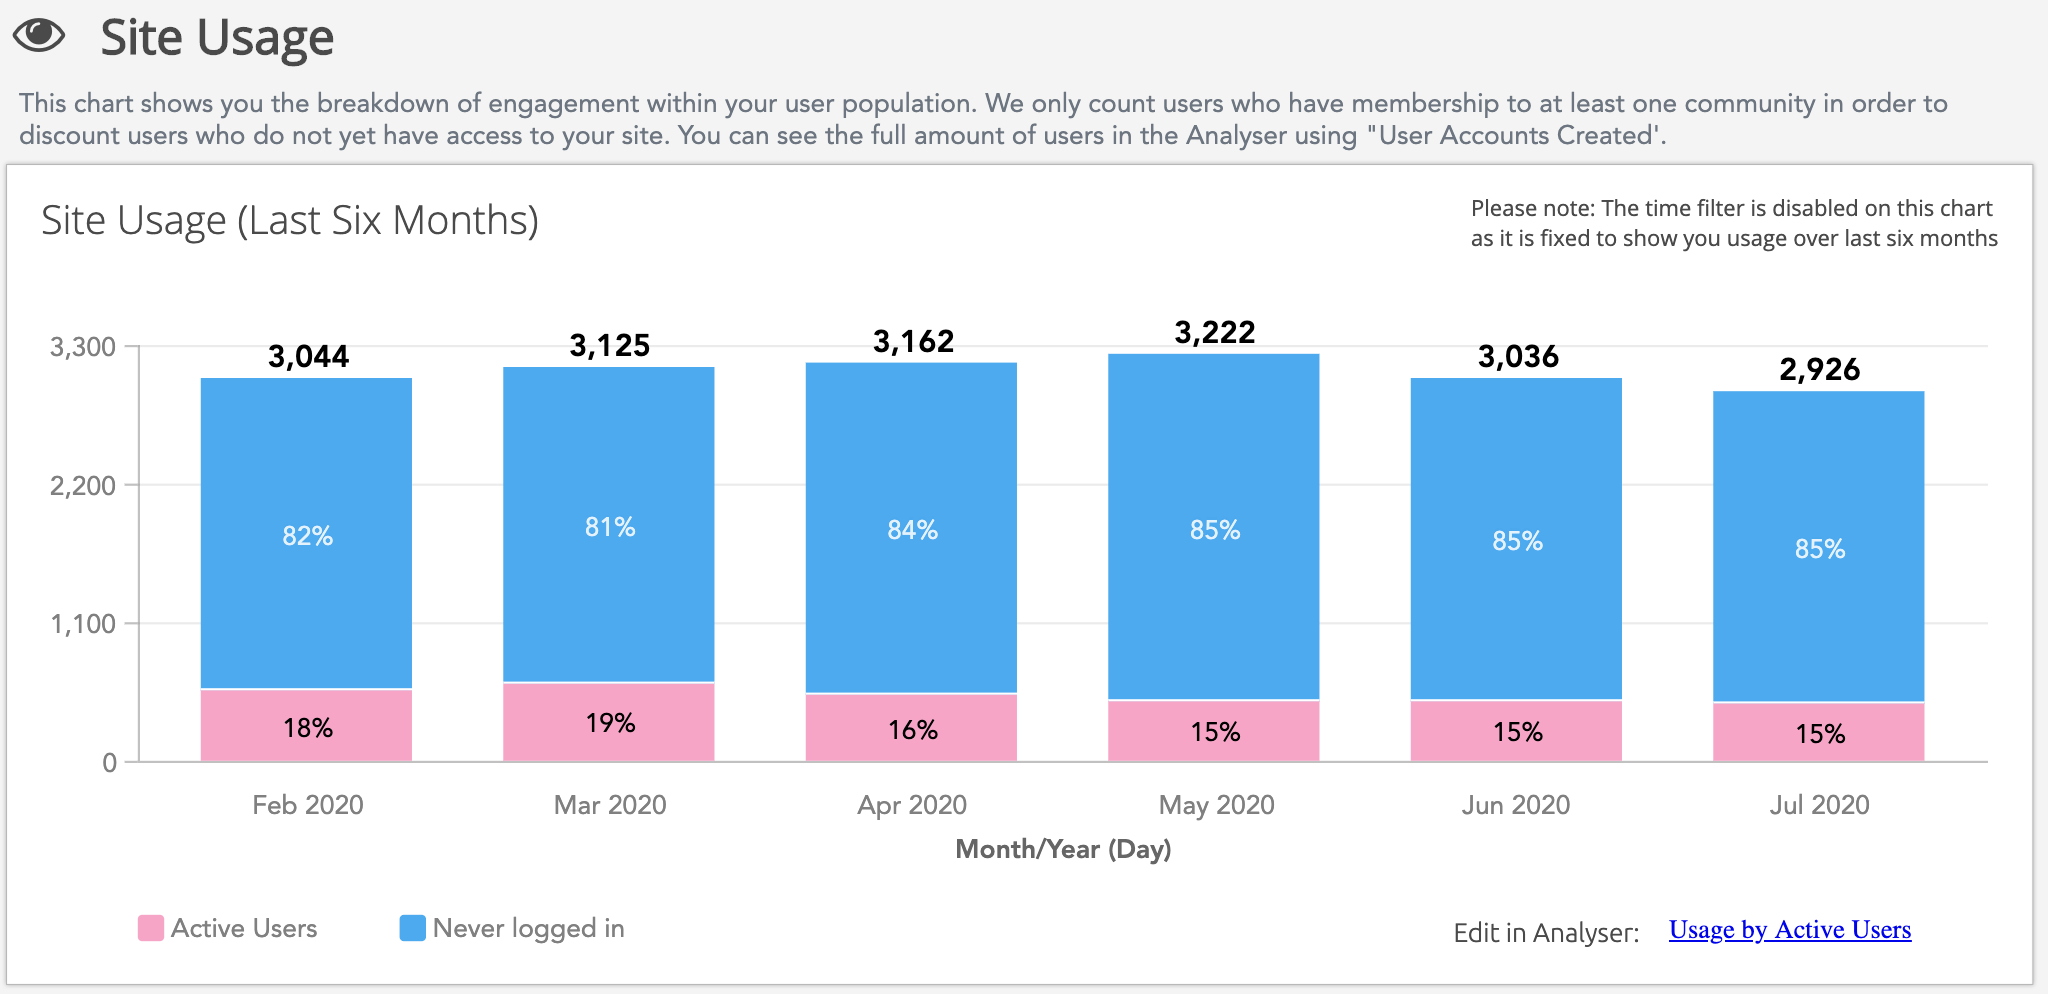
The bar chart in the Site Usage section in the Overview tab, shows you usage data for your Fuse instance over the last 6 months, including how many users have logged in to the instance verses how many have never logged in. This graph can be useful in understanding trends over longer periods of time.
Users must be a member of at least one community to be included in the data on the Site Usage bar chart. Users who do not yet have access to your Fuse instance are not included. You can see the total number of users (Including those without access to the instance) using the User Accounts Created option in the Analyser tool.
The TIME PERIOD filter is disabled for the Site Usage bar chart. The insights shown on this bar chart are taken from the past six months. This cannot be changed.
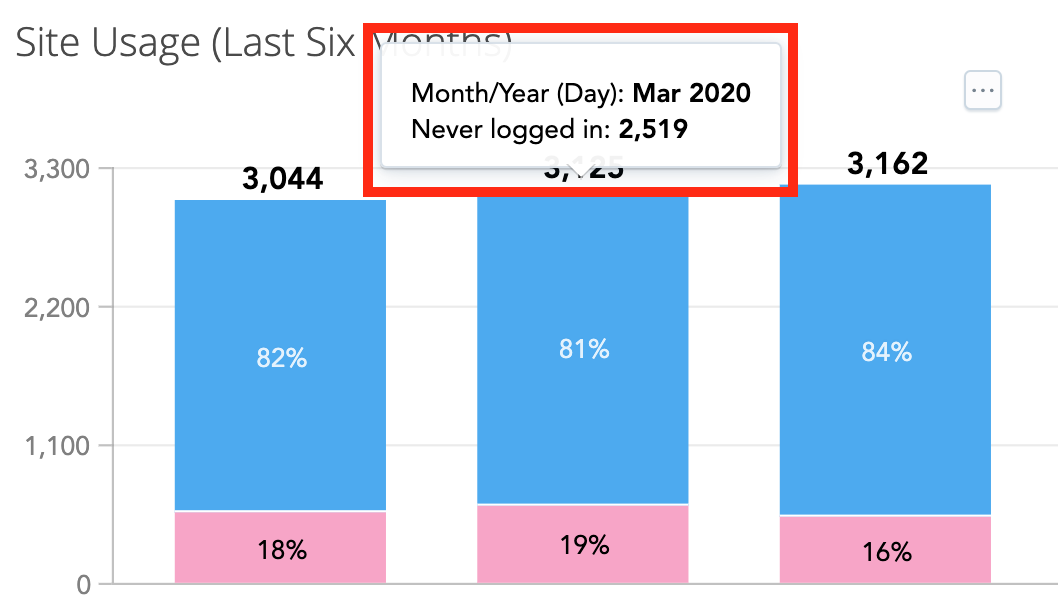
Hovering over the respective colours on each bar, reveals the numbers.
-
Hovering over the blue portion of the bar shows the number of users who've never logged in to Fuse.
-
Hovering over the pink portion of the bar shows the number of active users.
In example below you can see that in March 2020, there were 2,519 users who did not log in to Fuse, which is 81% of users.