
Click the Heatmap icon to visualise your data as a heatmap. Heatmaps can help you identify when something most and least often occurs in Fuse, as well as to identify patterns.

Example
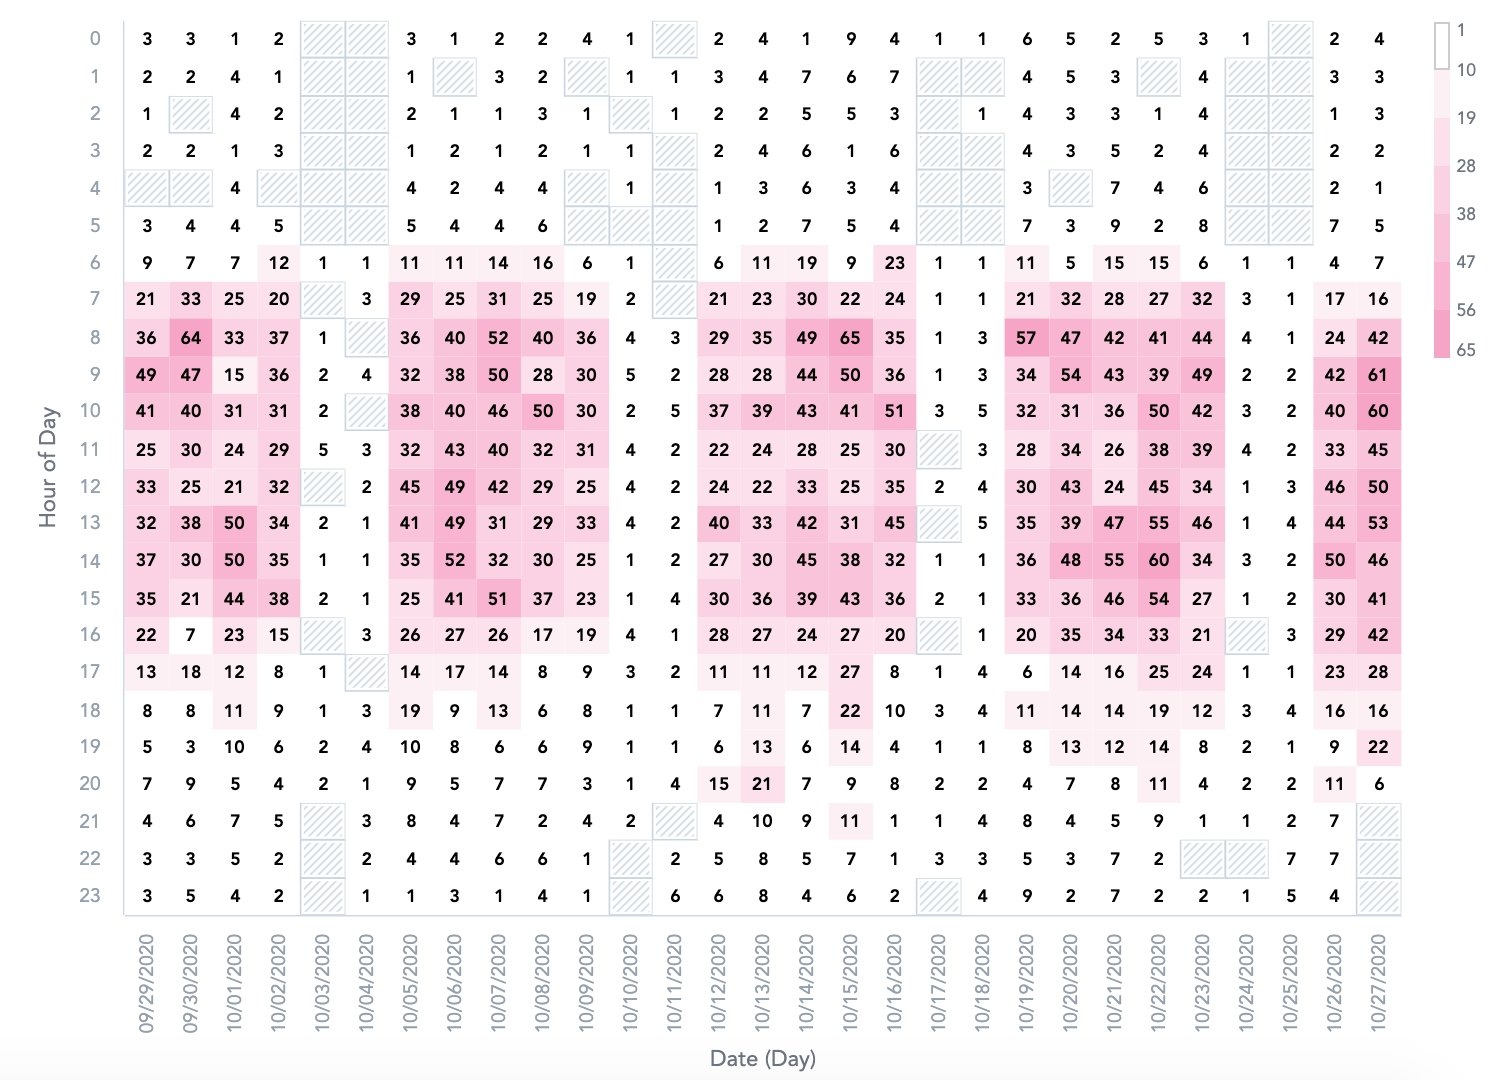
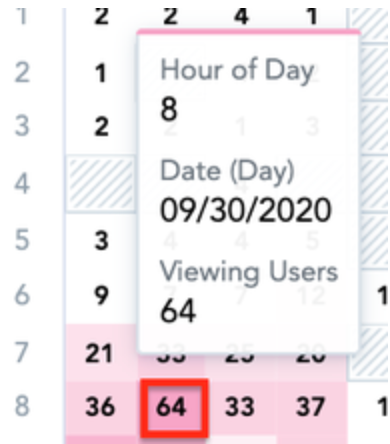
In the example below, this heatmap shows when content gets the most views, over the last 30 days.
-
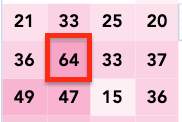
The darker tiles indicate a higher number of views. In the example below, 64 views were counted in this particular hour of the day.
-
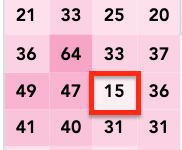
The lighter tiles indicate a smaller number of views. In the example below, 15 views were counted in this particular hour of the day.
-
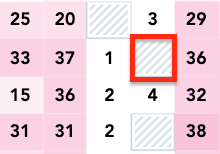
The tiles with diagonal lines, indicate no views were recorded.
Hover over a tile to reveal the details for a particular hour.
To recreate this example:
-
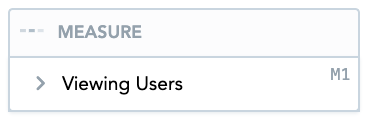
Drag Viewing Users from the Data Catalogue, into the Metric section.
-
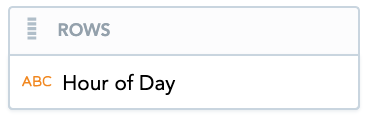
Drag Hour of Day from the Data Catalogue, into the Rows section.
-
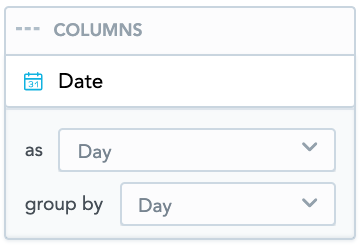
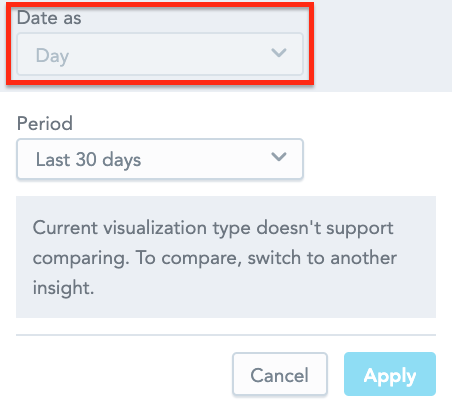
Drag Date from the Data Catalogue, to the Columns section. From the as dropdown, select Day. From the group by dropdown, select Day.
-
Drag Date from the Data Catalogue, into the Filters section.

The Day is selected by default.
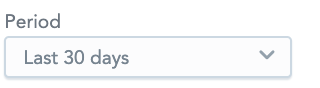
If necessary, you can change the time period using the Period dropdown. For example, if you select Last 30 Days, the views shown on the heatmap will be exclusively from the last 30 days.
Additional features
The Heatmap also allows you to:
Customise the look and feel
You can customise the look and feel of the chart to match your organisation's branding. For more information about customisation, see the Configuration section.