You can drag and drop attributes, facts, and metrics into a particular breakdown in the Analyzer tool.
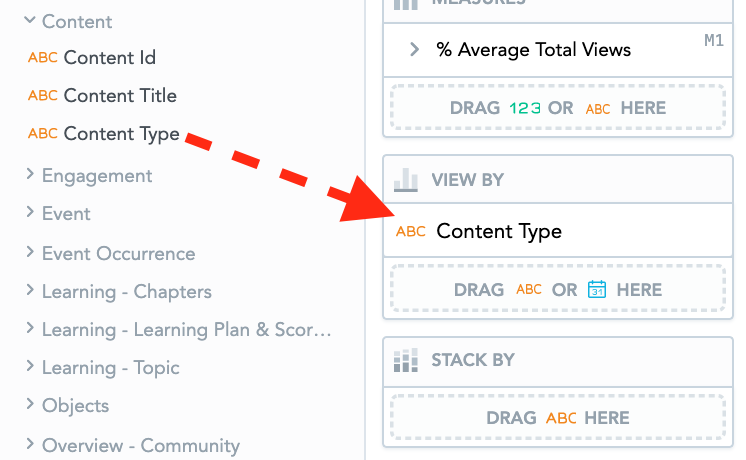
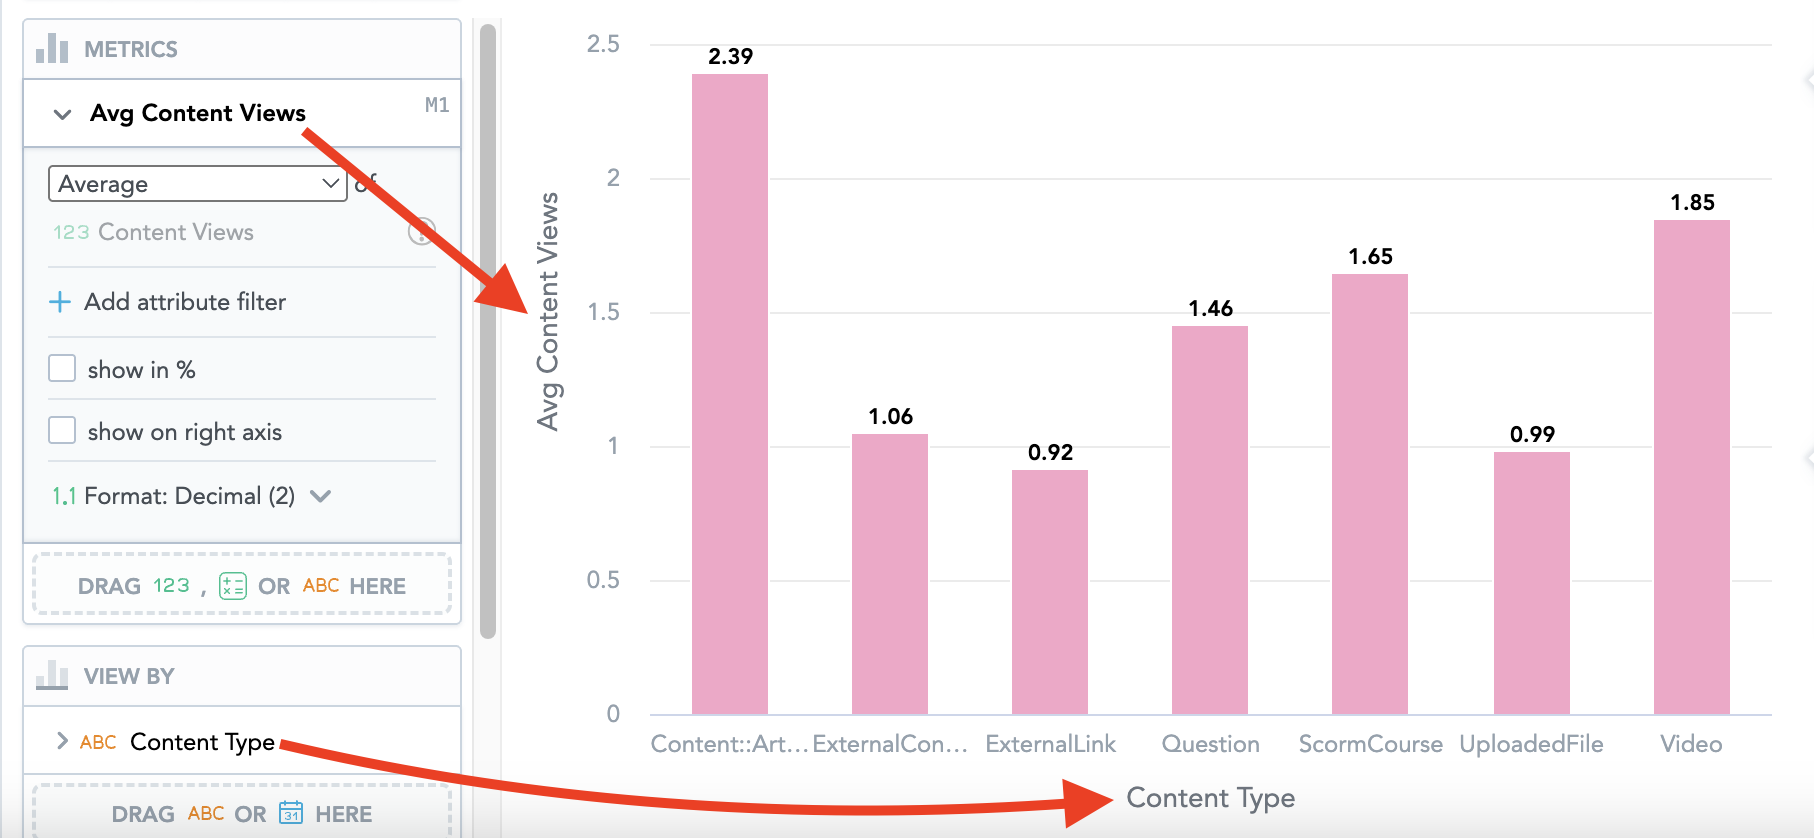
In the example below, Content Views has been added to the Y axis and the Content Type has been added to the X axis of this column chart.
Examples:
-
If you select the Table insight, you will see Metrics, Rows, and Columns. In this case the rows and columns are used to break down the data in a table.
-
If you select the Line chart option, the applicable breakdowns are Metrics, Trend By, and Segment By. In this case, Trend By and Segment By are used to break down the data on line chart.
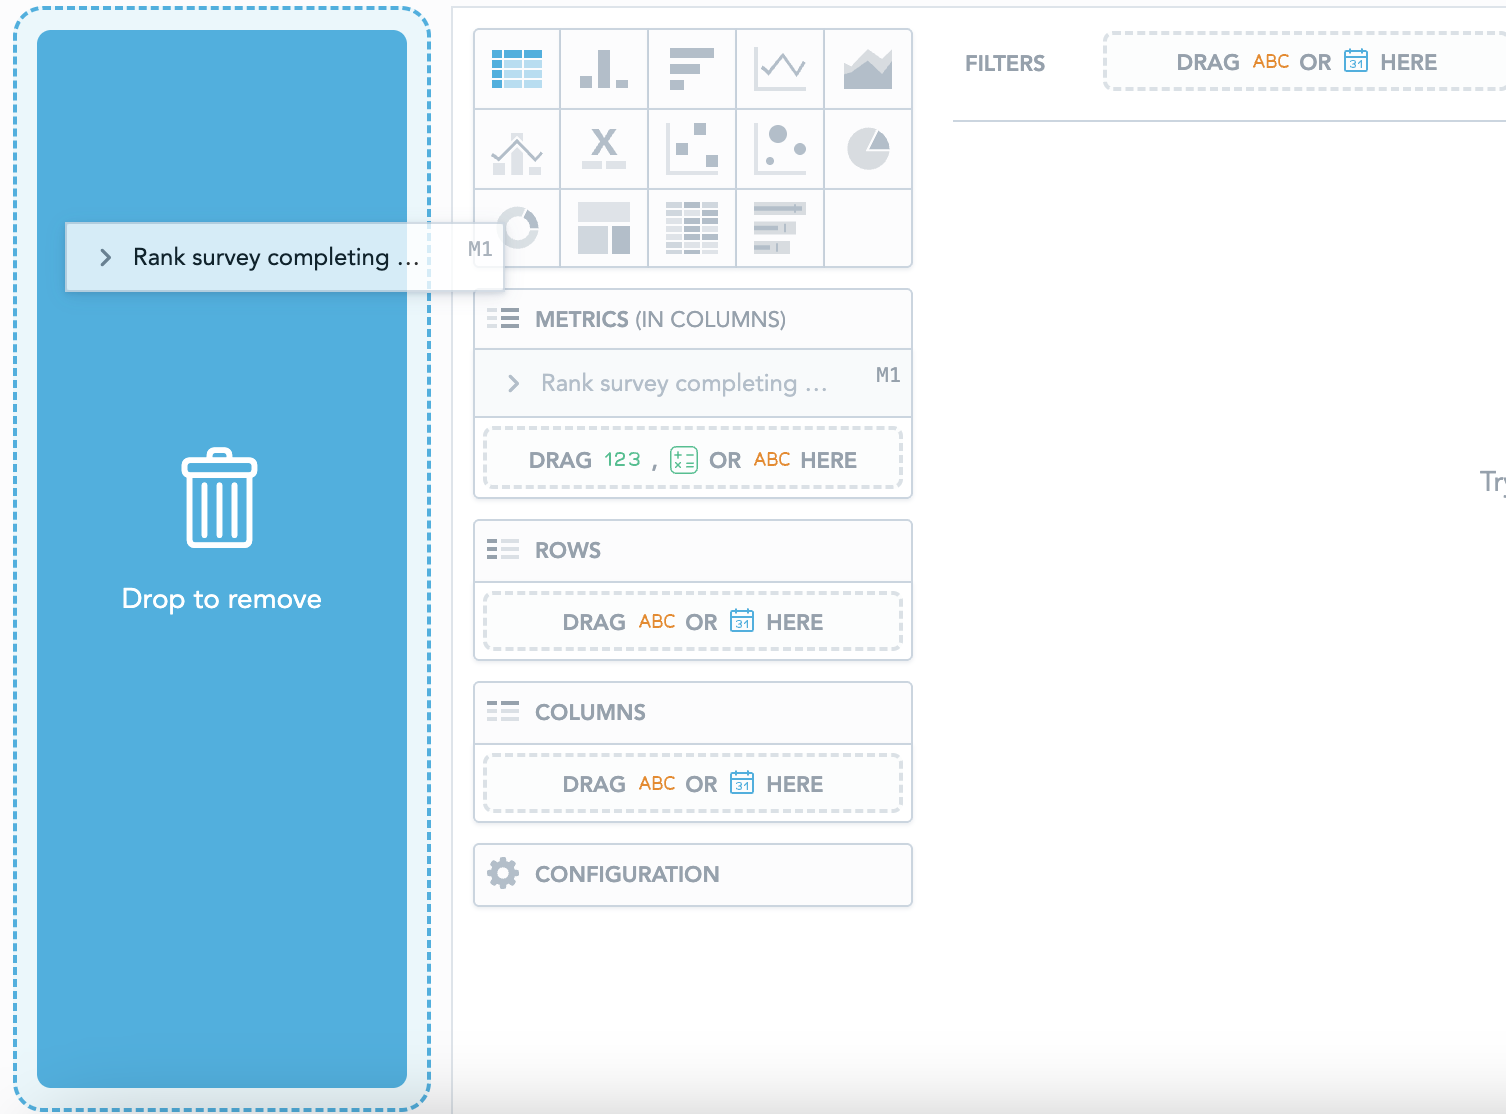
To remove a particular metric, fact or attribute from a breakdown, drag it back into the Data Catalogue: