
As well as creating brand new insights from scratch, Universal Analytics comes with several preconfigured insight templates, covering a variety of different areas, such as Most Popular Content, Topic Engagement, Survey Results, and Event Subscription, which can be used as a basis for your own custom insights.
You can view a preconfigured template in the Analyzer tool and then save a copy of it, so that you can make alterations, such as drag in new data from the Data Catalogue and customise the look and feel to match your organisation's branding.
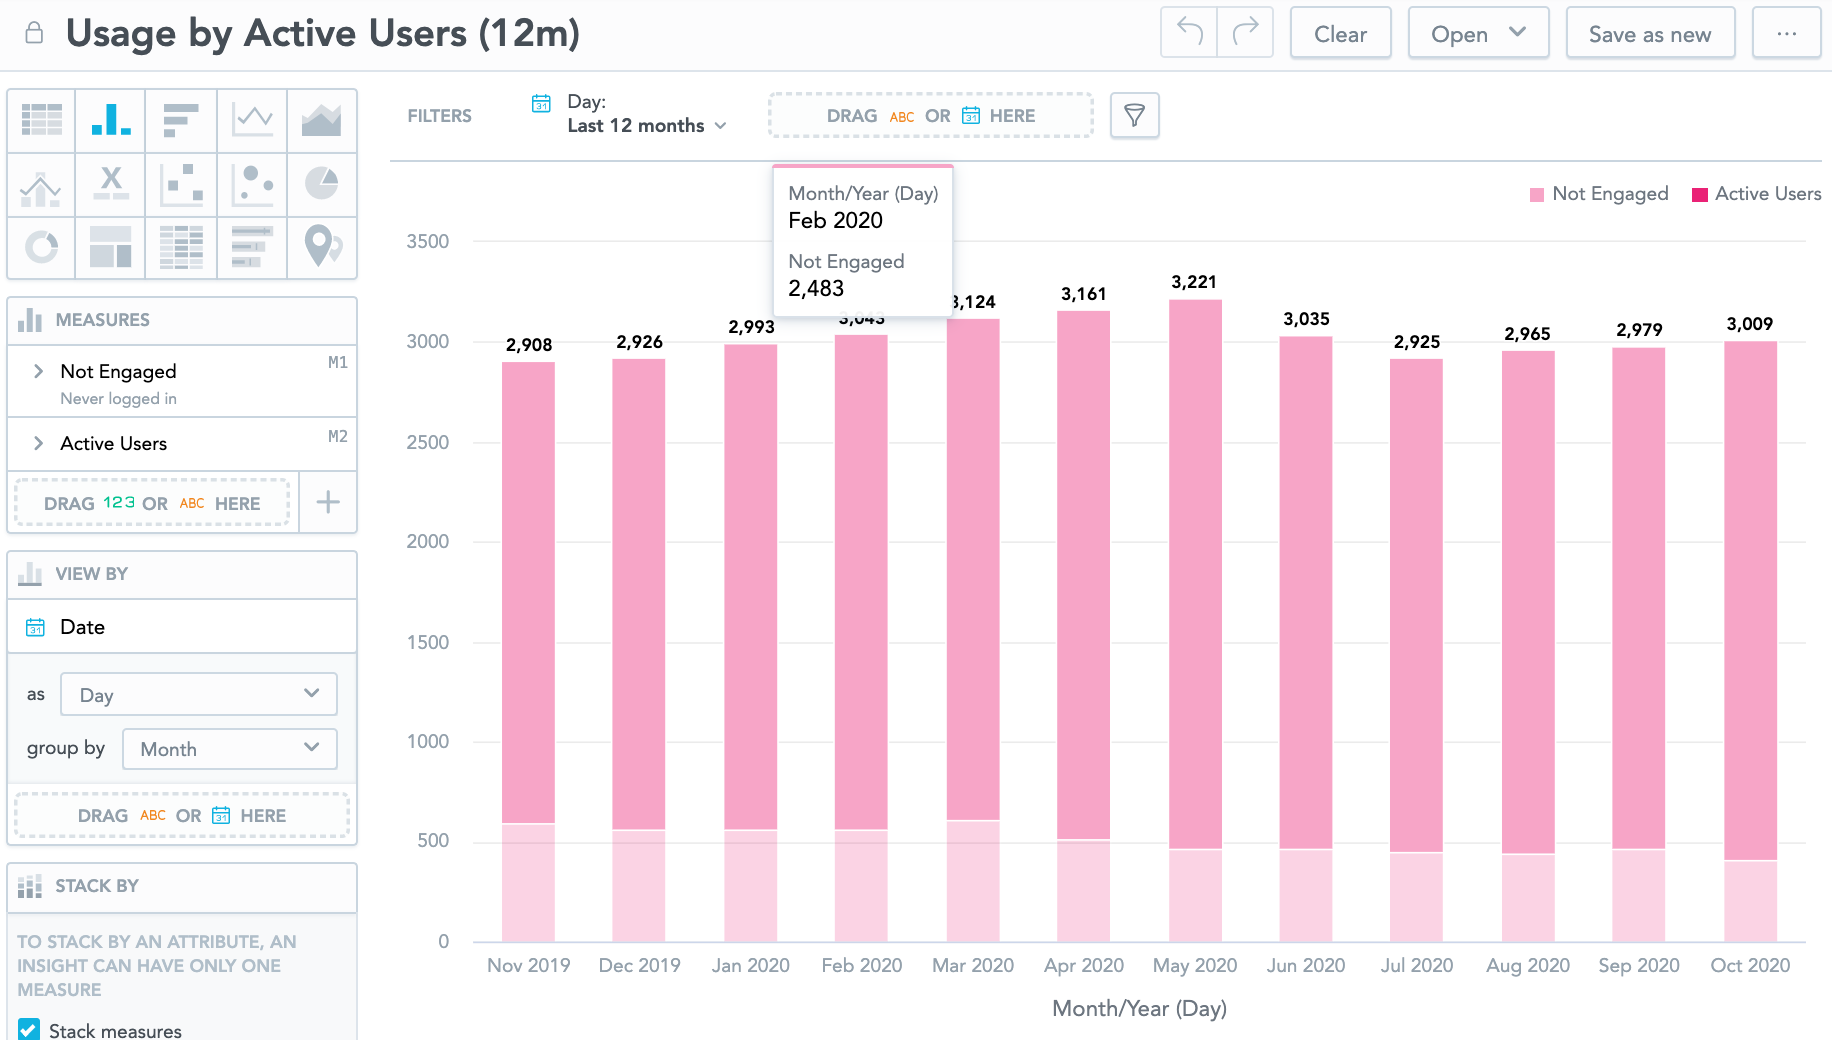
All preconfigured templates have a padlock icon next to the title. This means you cannot save any changes to the original template. To save changes, you must save a new copy of the template with a new name.

For a complete list of the available templates, see the List of preconfigured templates section below.
This section includes the following:
Opening and saving a copy of a template
To open a preconfigured template and save a copy of it:
-
In the Insight management section, click Open.
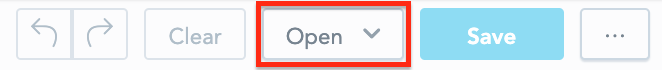
A menu appears.
-
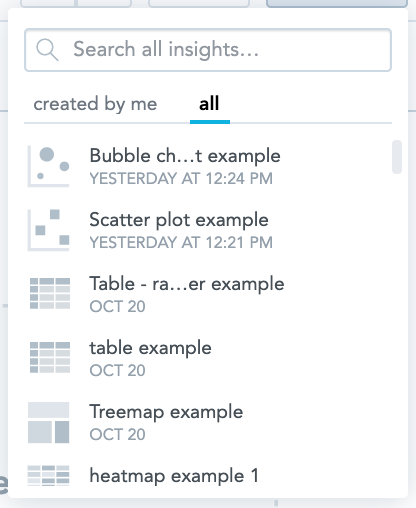
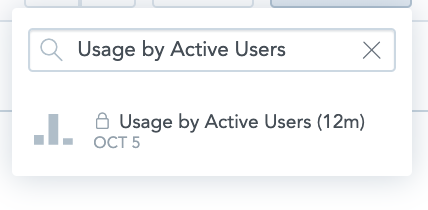
In the search bar, enter the name of an existing preconfigured template. A list of available templates can be found in the List of preconfigured templates section, at the bottom of this page.
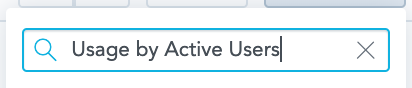
The list narrows down to show a list of matching templates.
-
Select the correct template and it opens in the Analyzer tool.
-
In the Insight management section, click Save as new.
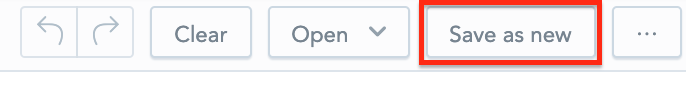
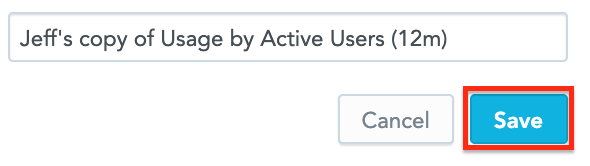
The Name your insight popup appears.
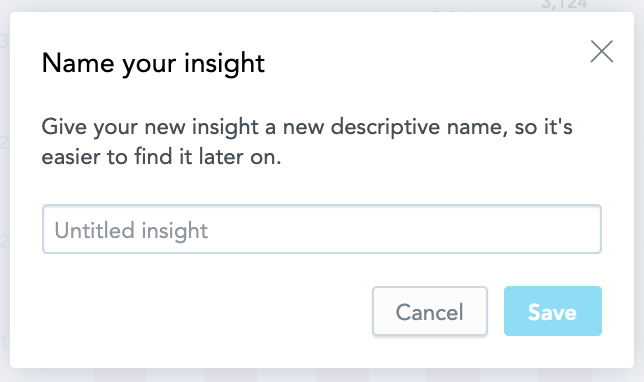
-
Enter a name for your copy of the template.
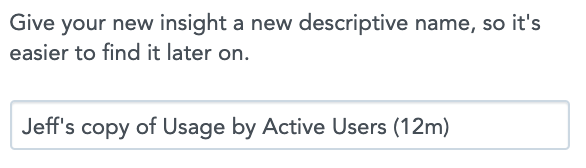
-
Click Save.
Once the copy has been saved, you can make any necessary alterations.
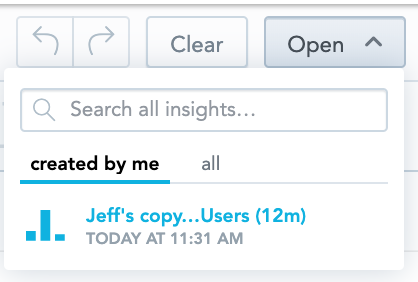
You can quickly locate any insights you have previously saved, by clicking the Created by me option in the Open dropdown.
List of preconfigured templates
The following preconfigured insight templates are available:
|
Title |
Description |
|---|---|
|
Usage by Active Users |
A column chart displaying both Active users and users who have not logged in to Fuse per month.
Data is shown over the past 12 months by default.
|
|
View % by Content Type |
A pie chart which shows the number of views per content type.
This table displays data from across all time by default.
|
|
Average Views by Content Type |
A column chart which shows the average views per content type.
This table displays data from across all time by default.
|
|
Video Content Analysis |
A table showing the view data for video content in Fuse, including the total number of views, average percentage of the video viewed by users, and the number of users who viewed the video. |
|
Most Popular Content |
A table listing the 10 most popular items of content in Fuse, ranked the number of views.
Data is shown over the past 12 months by default.
|
|
Views by Community Membership |
A table that lists the community members, content views, and average views by member per community.
This table displays data from across all time by default.
|
|
Communities by Engagement |
A table that lists engagement per community in Fuse, including:
This table displays data from across all time by default.
|
|
Engagement by Content Type |
A pie chart showing the total engagement for each content type in Fuse, as a percentage.
This table displays data from across all time by default.
|
|
Content by Engagement |
A table showing the total engagement, average engagement per user, and the number of comments, likes, Shares and follows per content item in Fuse.
This table displays data from the last 12 months by default.
|
|
Completion by Learning Plan |
A table showing the learning plan completion rate, current audience, and average progress, for each learning plan in Fuse.
This table displays data from across all time by default.
|
|
LP Completion by User |
A table showing the learning plan progress (as a percentage) and the status for a learning plan, for each user in Fuse.
This table displays data from across all time by default.
|
|
LP by Engagement |
A table showing the community membership, total engagement, average engagement per audience member, and the number of likes, shares, comments and follows for each learning plan in Fuse.
This table displays data from across all time by default.
|
|
Topic Completion by User |
A table showing the progress made in each topic by each user in Fuse.
This table displays data from across all time by default.
|
|
Topic Completion by Topic |
A table showing the audience, completions, and the number of users who are currently in progress for each topic in Fuse.
This table displays data from across all time by default.
|
|
Topic by Engagement |
A table showing the number of content items, total engagement, and the number of views, likes, shares and comments for each topic in Fuse.
This table displays data from across all time by default.
|
|
SCORM by Engagement |
A table showing the memberships, total engagement, engagement per membership, and the number of views, likes, shares, comments and follows for each SCORM course in Fuse.
This table displays data from across all time by default.
|
|
SCORM Completion by User |
A table showing each user's completion score, duration, and status for a SCORM course.
This table displays data from across all time by default.
|
|
SCORM Completion by Course |
A table showing the average SCORM score, duration, and number of completions for each SCORM course in Fuse.
This table displays data from across all time by default.
|
|
User Attendance by Event Occurrence |
A table showing user attendance for each event/occurrence.
This table displays data from across all time by default.
|
|
Events by Popularity |
A table ranking events by popularity (Attendance %). In addition there is a breakdown of:
This table displays data from across all time by default.
|
|
Events by Subscription % |
A table displaying event subscription data, including:
|
|
Formal Assessments Overview |
A table showing the percentage of attempts, incomplete attempts, and failed attempts for each formal assessment created in a topic.
|
|
Formal Assessments by User |
A table showing each user's formal assessment details. This includes the highest assessment score, number of attempts, number of correct answers, number of wrong answers, and the assessment status for each user in each topic.
|
|
Survey Results |
A table showing results data for each survey in Fuse, including:
This table displays data from across all time by default.
|
|
One-to-One sessions by Reportee |
A table showing the list of one-to-one session details for each reportee in Fuse, including:
This table displays data from across all time by default.
|
|
One-to-One sessions by Manager |
A table showing a list of one-to-one sessions for each manager in Fuse, including:
This table displays data from across all time by default.
|
|
One-to-ones - coached users (last 12 months) |
A bar chart that shows the number of users being coached via one-to-one sessions per month. This bar chart displays data from the past 12 months.
|
|
Observations - current assigned managers to a user |
A table showing a list of users and their assigned manager(s). |
|
Observations - by User |
Table showing the answers given by each user, to questions in each observational assessment. This table displays data from across all time by default.
|
|
Observations - by Manager |
A table showing a list of managers, the number of observational assessments they have carried out and their status for each of their reportees. This bar chart displays data from the past 12 months.
|
|
Observed Users (last 12 months) |
A column chart showing the number of users being observed per month. This bar chart displays data from the past 12 months.
|
|
Performance Gaps |
A table that gives an overview of performance gaps. This includes how many users gave which answer per question in an observational assessment. This table displays data from across all time by default.
|
|
Active Users by Month |
A column chart showing the number of active users per month.
This column chart displays data from the past 12 months.
|
|
Usage by Engaged Users (12M) |
A column chart displaying the number of engaged and non-engaged users (which will also includes active who are not engaging with content) per month.
This column chart displays data from the past 12 months.
|