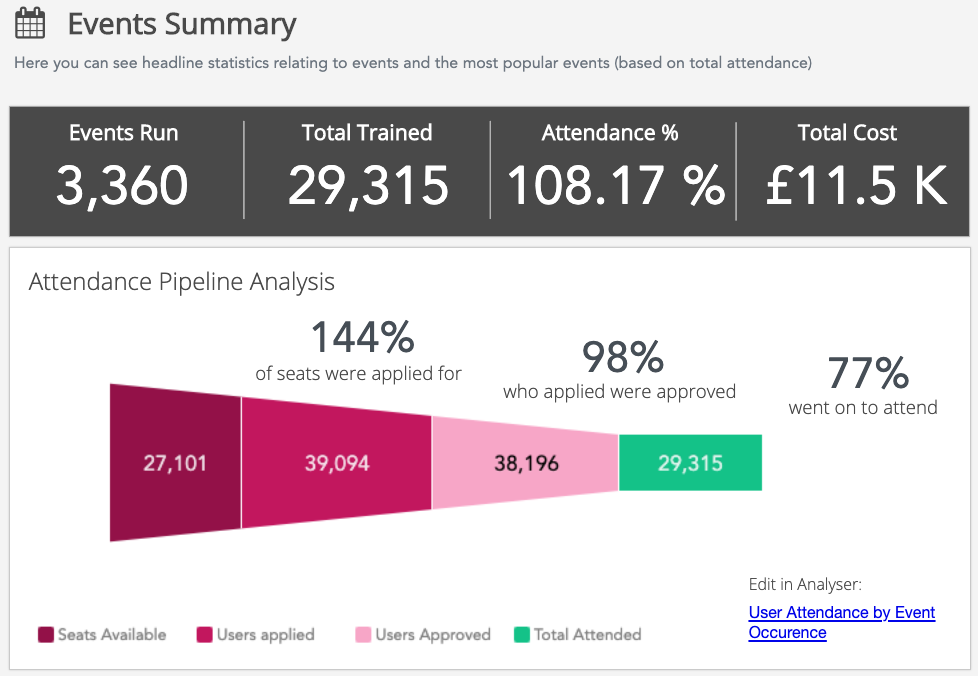
The Events Summary section in the Events tab, shows the number of events that have been run, the total number of users trained by attending events, and the percentage of users who have attended events, based on filters selected in the Filter By section.
The following insights are shown:
|
Insight |
Description |
|---|---|
|
Events Run |
The total number of events that have taken place in the Fuse instance, based on filters selected in the Filter By section. In the example below, a total of 314 events have taken place over the defined time period. 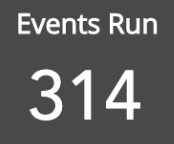
|
|
Total Trained |
Total number of users who have been trained by attending events, based on filters selected in the Filter By section. In the example below, 3,082 users were trained by taking part in events held over the defined time period. 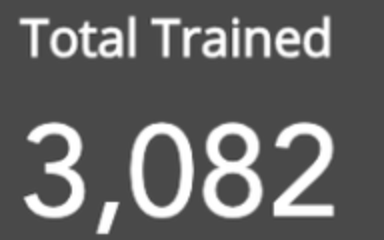
|
|
Attendance % |
Percentage of users that have attended events as a percentage of seats available, based on filters selected in the Filter By section. In the example below, 37.77 % of users attended events held over the defined time period. 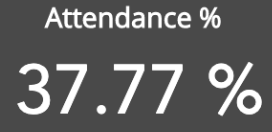
|
|
Total Cost |
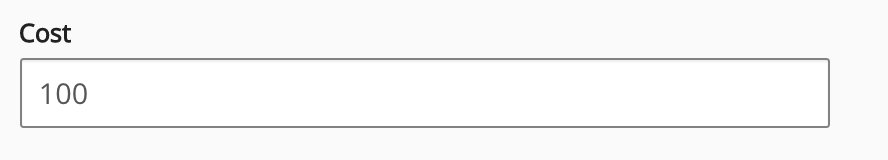
The total cost of running each of event, added together. (If applicable). 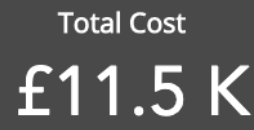
When creating an event, you can enter how much it costs users to attend. This is done by entering a numerical figure in the Cost field on the Creating a new event screen. Universal analytics only counts the cost of an event if it contains numeric values (special characters and text are not counted). We strongly advise customers with users in multiple countries, to fill out the Cost field using a single currency rather than multiple currencies, so that the cost-benefit analysis in Universal Analytics is able to pick up all values entered in the Cost field. |
|
Attendance Pipeline Analysis |
This funnel gives shows you how many users are have applied to attend events vs how many of those users eventually attended them. This data can give you an indication of how successful events are, as well as the drop off rates at each stage. If a high number of users are registering to attend events but then don't actually attend them, you could try and find ways of making future events more appealing, in order to encourage users to attend. For example, changing the format for how an event is run, such as moving it exclusively online. If you fail to boost attendance numbers by making changes to future events, you might want to stop creating those events altogether, as running them with few attendees might be costly. Examples In this example, we can conclude that the organisation needs to focus on getting more users to apply for events that are organised, as the number of subscriptions is only 50%. 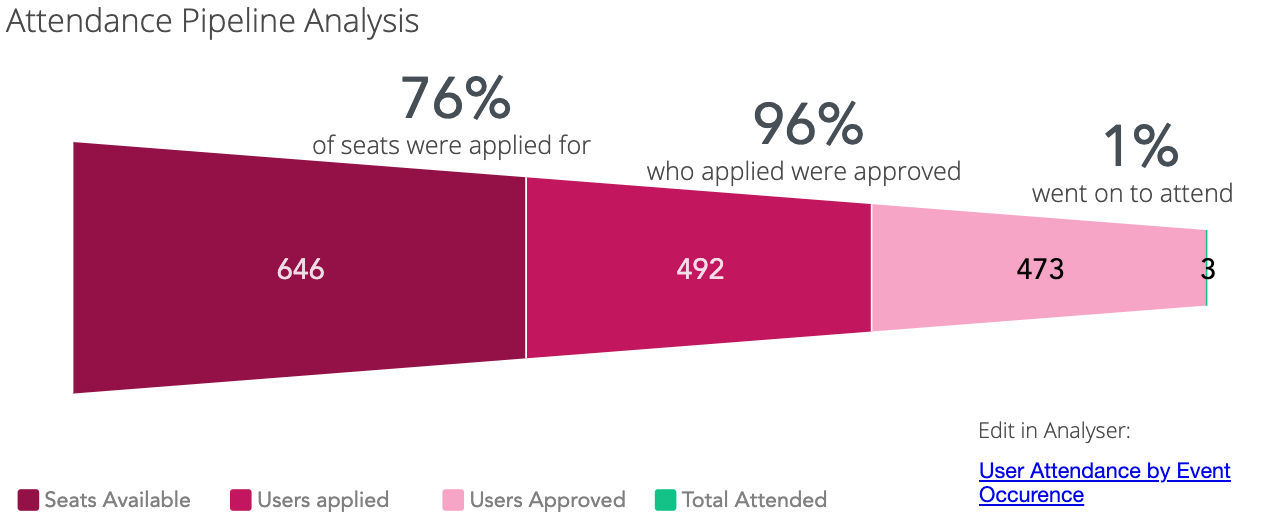
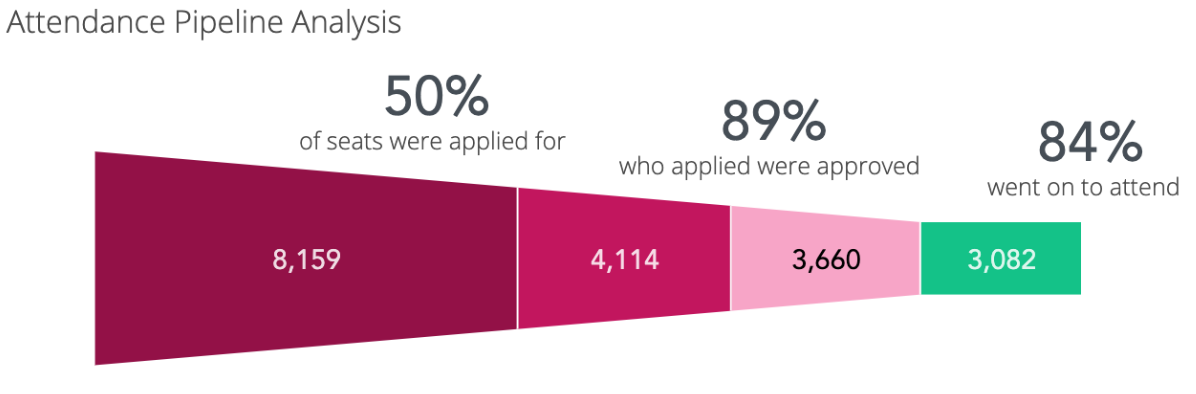
Hover over each colour in the legend to isolate specific data on the funnel. 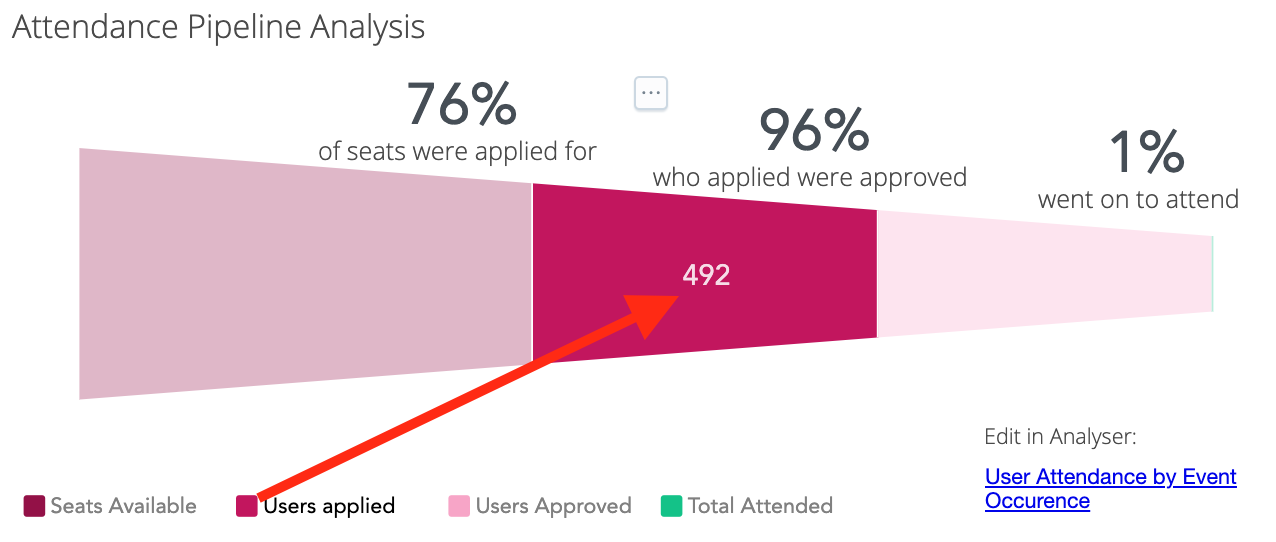
|