
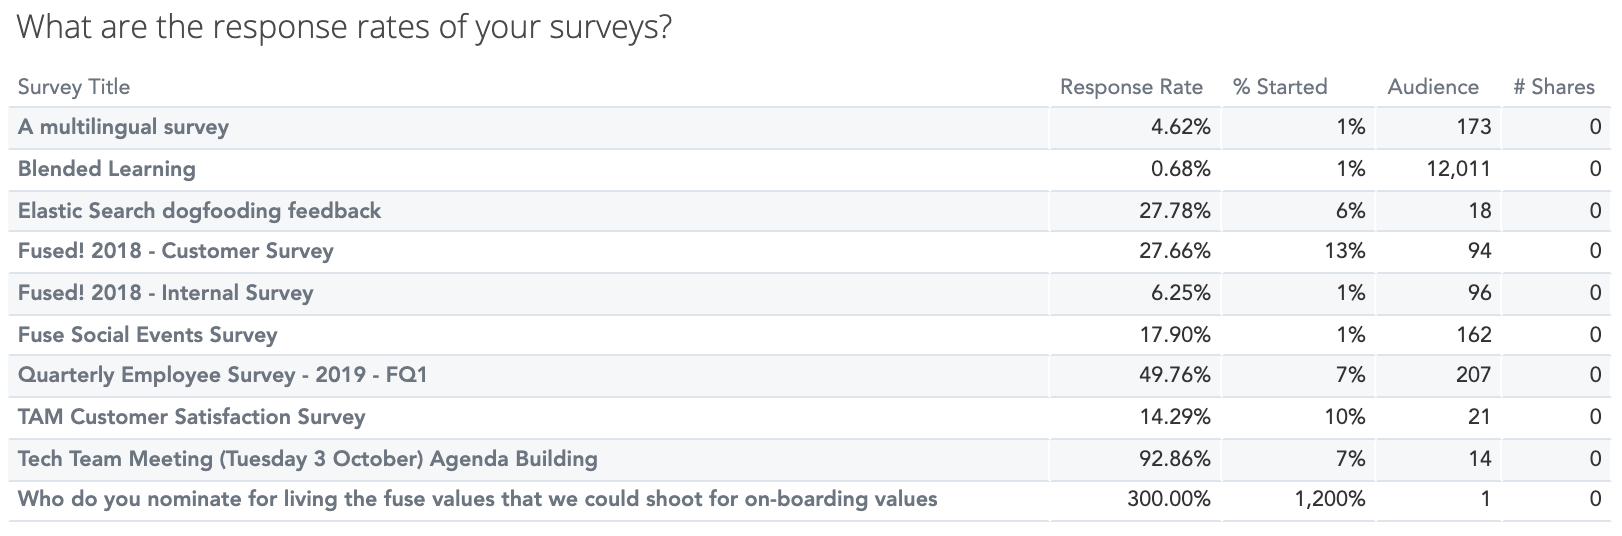
The Survey Analysis section in the Surveys tab, contains a table showing the top 10 surveys with the lowest response rate, based on filters selected in the Filter By section.
You might consider engaging with your intended user audience to make them aware of a survey or understand why the intended users are not completing surveys. A response rate is important to make sure you don't have a sampling bias.
In the example it below, the response rate for surveys is 10.91%, which is below the average of 33%. In this case you might want to re-share it again to increase response, or perhaps ask more senior leadership to sponsor/promote it, in order to increase the response rate.
The following information is shown on the table:
|
Table Header |
Description |
|---|---|
|
Survey Title |
The title of the survey. |
|
Response Rate |
The percentage of the total intended audience for the survey The intended audience are the users you have shared the survey with. |
|
% Started |
The percentage of users who have started the survey but have not completed it. |
|
Audience |
The percentage of users the survey has been shared with. The audience are users you have shared the survey with. |
|
#Shares |
The number of times the survey has been shared. |