
The Engagement Analysis section in the Engagement tab, shows insights and trends related to your user's engagement with content, such as the number of likes, comments, shares, and follows, as well as the number of questions posted.
All trend indicators are based on a 30 day period. In the example below, the number of likes has increased by 23% when compared to the same time 30 days prior. This means the number of likes has increased by 88 when compared to 30 days before.
The following insights are shown:
|
Insight |
Description |
|---|---|
|
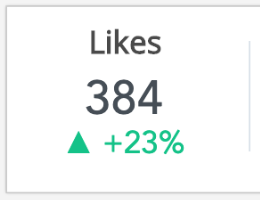
Engagement Rate |
Shows the engagement rate (through users liking, commenting, sharing and following content) in the Fuse instance. This metric can help you understand how engaged your users are, as this is an indication of the number of engagements divided by the number of users engaging with content, shown as a percentage. An engagement rate of 100% means that on average, every user engaged at least once with an item of content, by liking, sharing, commenting or following it. In the example below, the engagement rate in the Fuse instance has increased by 2.2% when compared to the same time 30 days prior. This means there has been an increase of 14.09%. In the previous period, the engagement rate was 625.65%, meaning that on average, there was an average of 6.25 engagements with content for the selected time period. 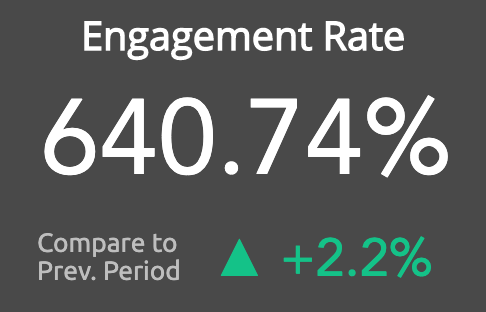
|
|
Total Engagements |
Shows the total number of engagements (likes, shares, comments, and follows) in the Fuse instance, based on the filters selected in the Filter By section. In the example below, the total number of engagements have increased by 4.8% when compared to the same time 30 days prior. This means the number of engagements has increased by 74 compared to 30 days before. 
|
|
Engagement Rate Trend |
Shows the engagement rate day by day over a 7 day period, based on the time period selected in the TIME PERIOD filter in the Filter By section. 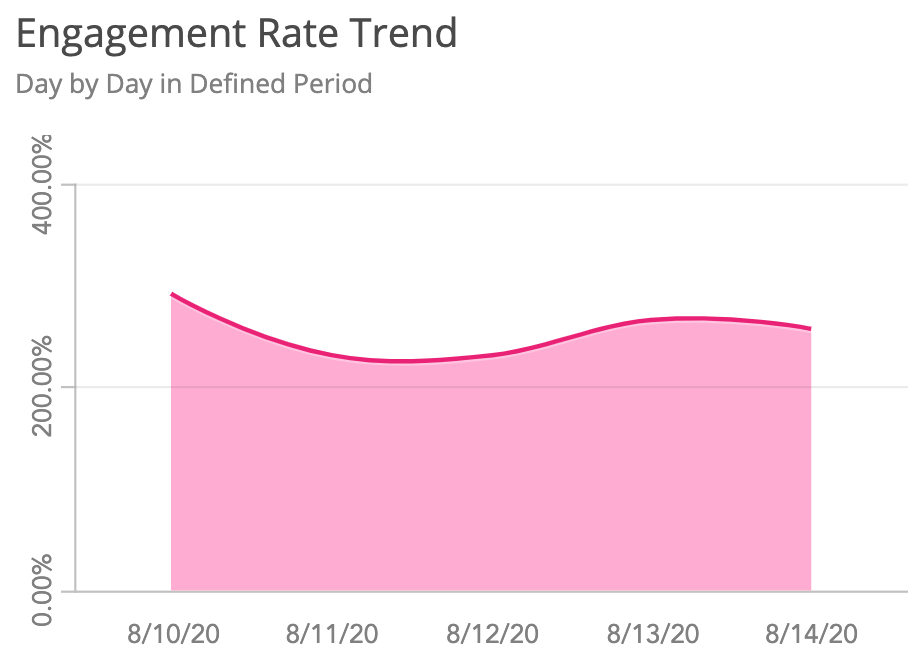
Hover over the line on the graph to see the engagement rate for a specific day. 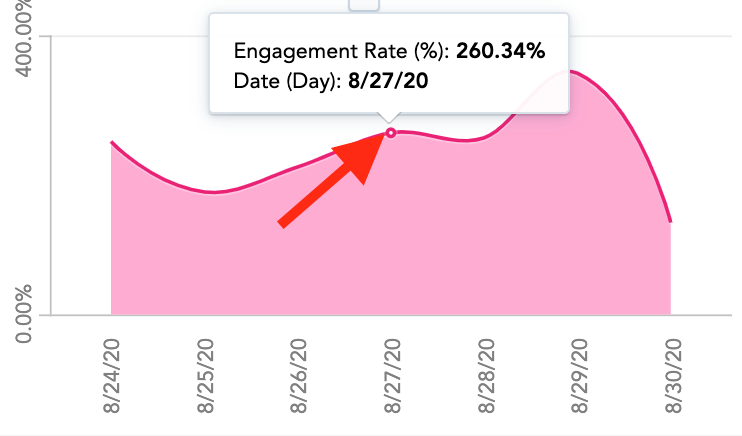
|
|
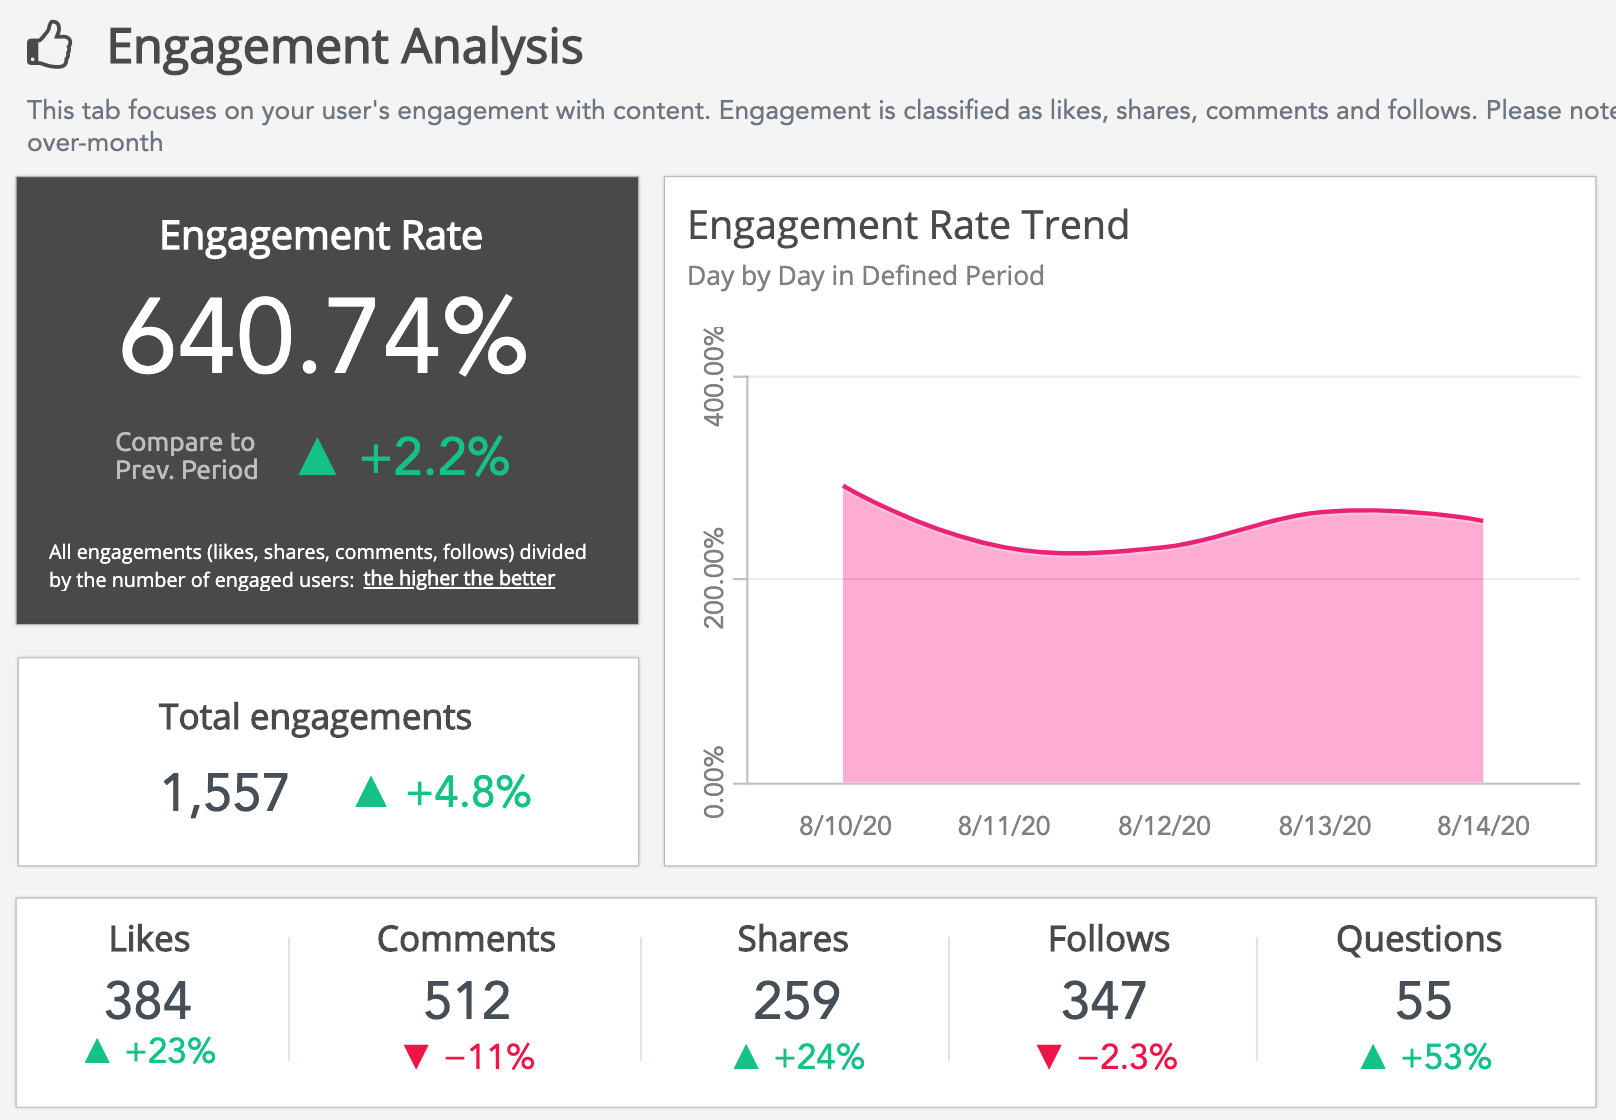
Likes |
Shows the total number of likes in the Fuse instance, based on the filters selected in the Filter By section. Likes can indicate how positively your audience are responding to content. Likes are an indication of how positively your audience is responding.
You can also see upward/downward trends. In the example below, the number of likes has increased by 23% when compared to the same time 30 days prior. This means the number of likes increased by 88, when compared to the same time 30 days before. After this, you can try and understand what the most popular content is in your Fuse instance. 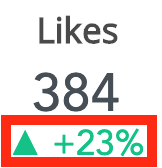
|
|
Comments |
Shows the number of comments posted on content in the Fuse instance, based on the filters selected in the Filter By section. The number of comments are indicative of a good conversation happening around content. Having great conversations in the comments underneath an item of content not only allows users to engage with content, but also gives users the opportunity to learn through the sharing of knowledge (which is a great indication of a learning culture). You can also see upward/downward trends. In the example below, the number of comments posted on content has decreased by 11%, when compared to the same time 30 days prior. This means the number of comments has decreased by 56, when compared to the same time 30 days before. 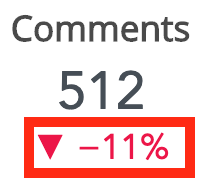
|
|
Shares |
Shows how many times users have shared content in the Fuse instance, based on the filters selected in the Filter By section. Users can share knowledge with each other by sharing an item of content. Sharing knowledge is indication of great learning culture in an organisation. You can also see upward/downward trends. In the example below, the number of content shares has increased by 24% when compared to the same time 30 days prior. This means the number of shares has increased by 62, when compared to the same time 30 days before. 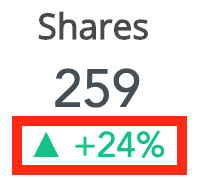
|
|
Follows |
Shows how many times users have followed an item of content in the Fuse instance, based on the filters selected in the Filter By section. Following an item of content shows that users are curious to understand what is happening with the conversation going on underneath, as well as any other engagements associated with the item of content. You can also see upward/downward trends. In the example below, the number of users following content has decreased by 2.3% when compared to the same time 30 days prior. This means the number of follows has decreased by 7, when compared to the same time 30 days before. 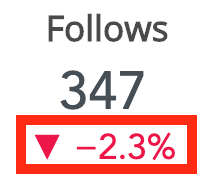
|
|
Questions |
Shows how many times users have posted questions in the Fuse instance, based on filters selected in the Filter By section. Questions are a great way to understand and identify knowledge gaps within your audience. If users repeatedly post the same/similar question, it shows there is a lack of knowledge in that particular subject area. Questions also allow users to learn from each other by actively answering each other's questions. You can also see upward/downward trends. In the example below, the number of users posting questions has increased by 53%, when compared to the same time 30 days prior. This means the number of questions has increased by 29, when compared to the same time 30 days before. 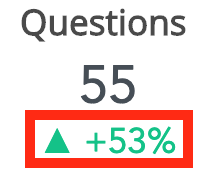
|