
Click the Bullet chart icon to visualise your data as a bullet chart. Bullet charts allow you to make comparisons between two different metrics and a target.

Example
In the example below this bullet chart compares:
-
The total number of users who attended a particular event
-
The number of users who applied to attend the event
-
The total number of seats that were available at the event (The target that should have been reached).
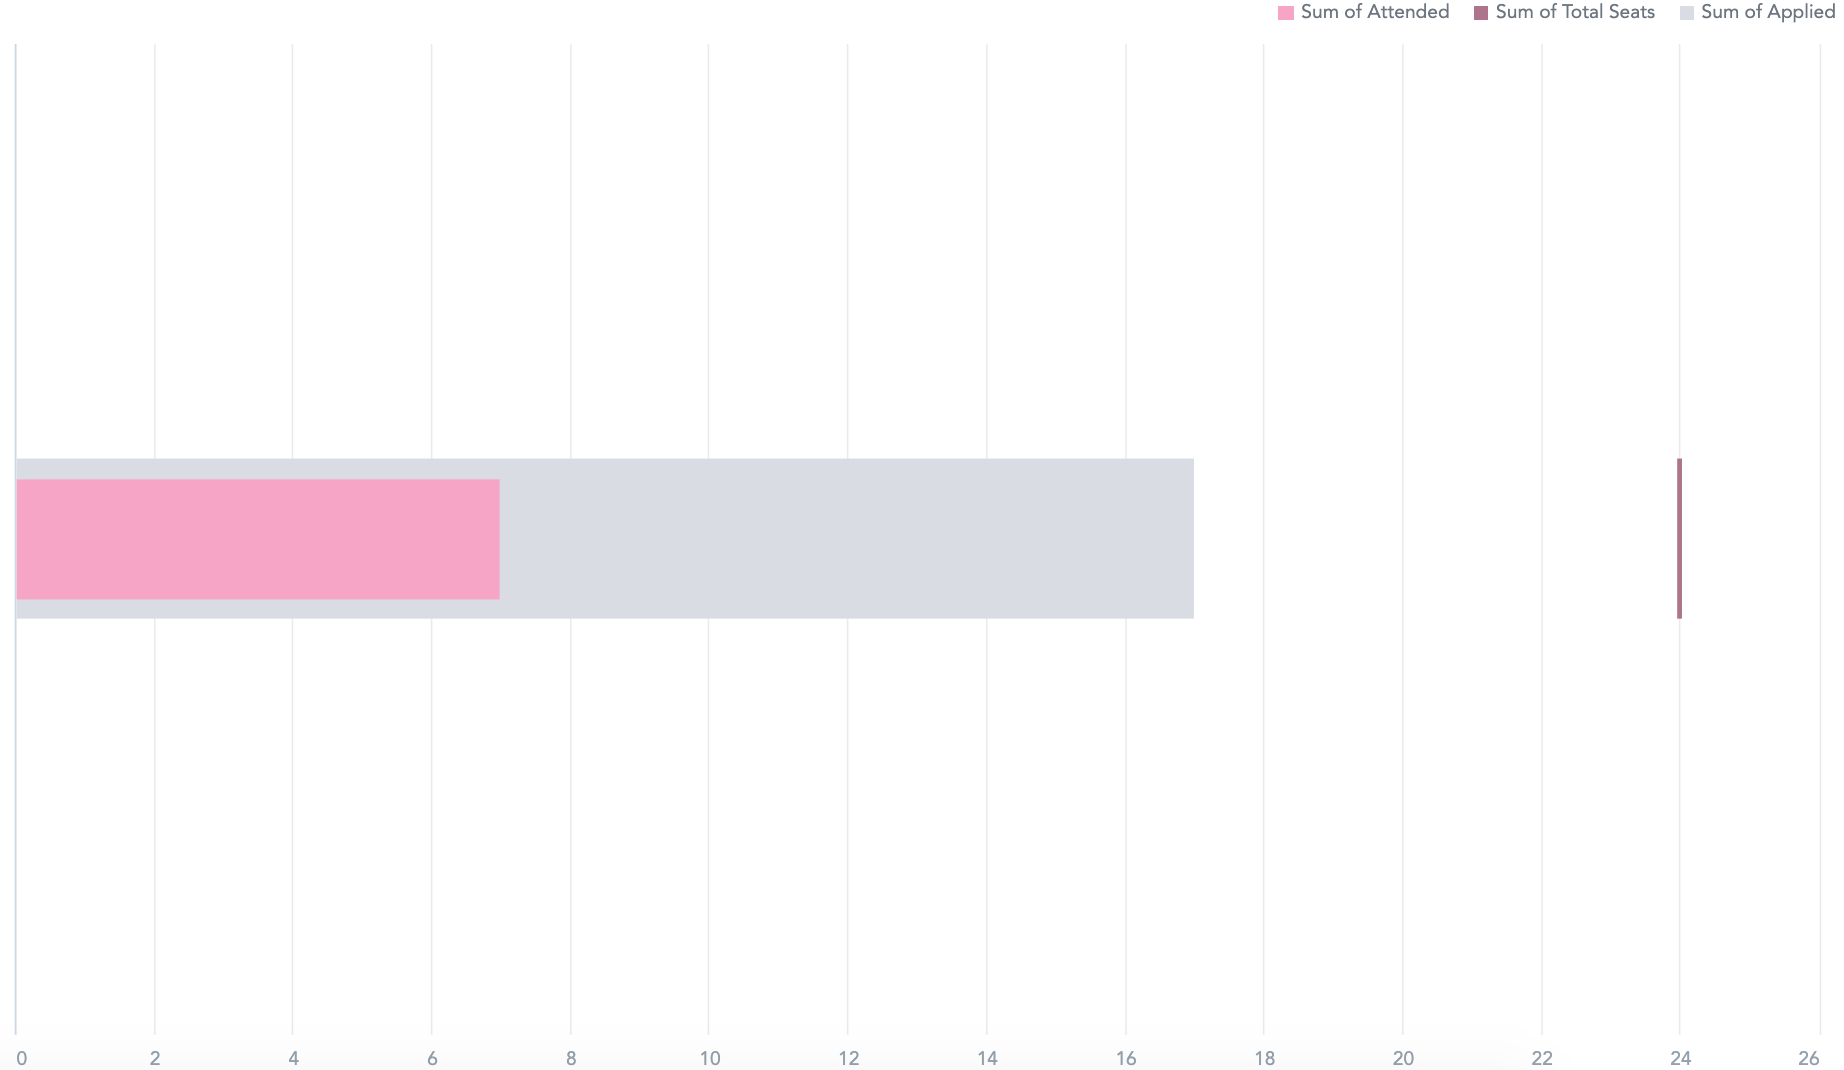
The chart shows that: -
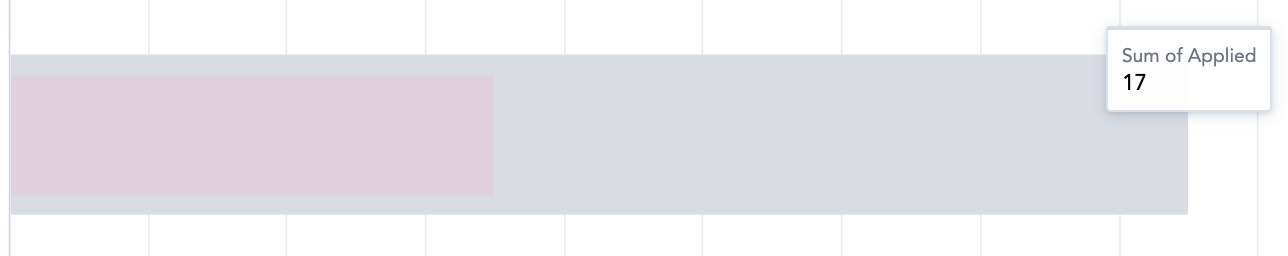
17 users applied to attend the event.
-
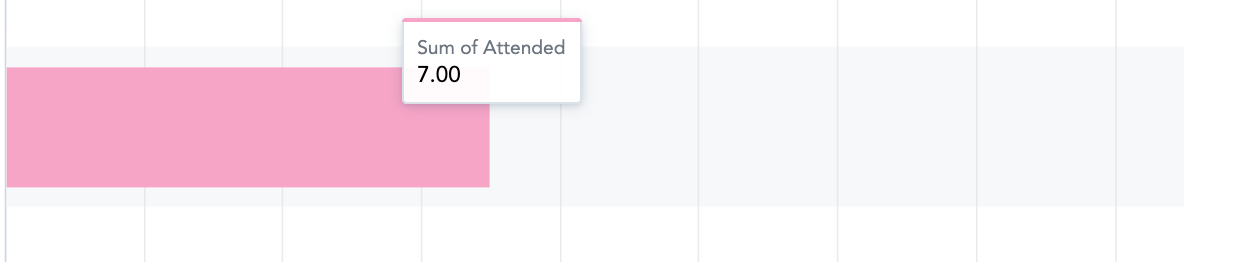
A total of 7 users actually attended the event.
-
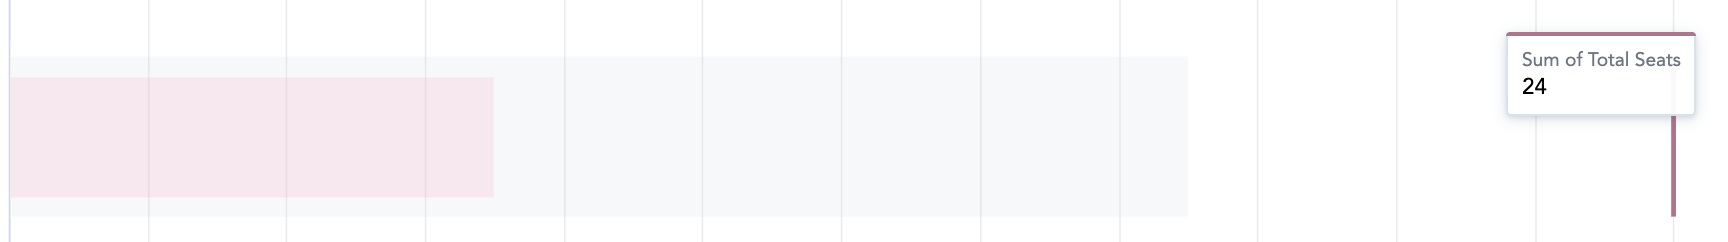
A total of 24 seats were available at the event. Ideally, the target for the event was to fill all 24 available seats. However, in this example, only 7 of those seats were actually filled.
To recreate this example:
-
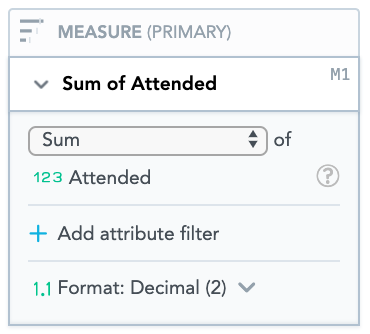
Drag Number of Users Attended from the Data Catalogue, into the Metric (PRIMARY) section.
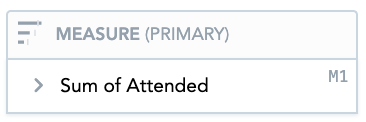
Ensure that Sum is selected, so that the total number of users attending the event is displayed.
-
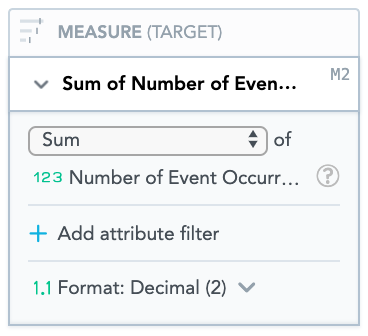
Drag Number of Event Occurrence Seats from the Data Catalogue, into the Metric (Target) section.
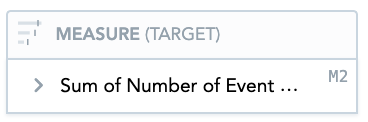
Ensure that Sum is selected, so that the total number of available seats at the event is displayed.
-
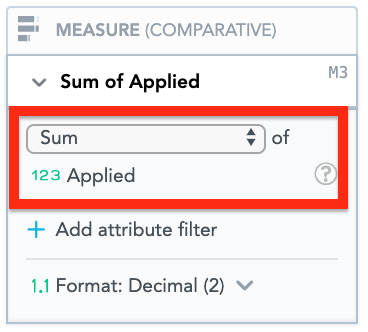
Drag Applied from the Data Catalogue, into the Metric (Comparative) section.
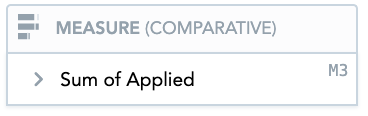
Ensure that Sum is selected, so that the total number of users who applied to attend the event is displayed.
-
Drag Event Name from the Data Catalogue, into the Filters section. Then select a particular event from the dropdown.
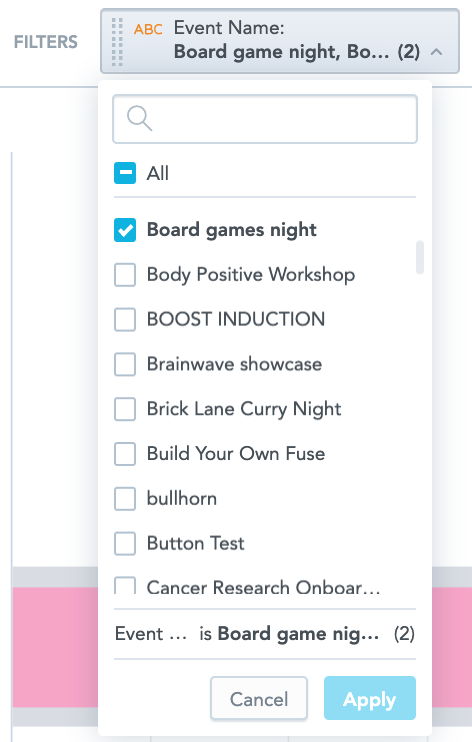
You can select multiple events if you want to compare several events together in the same chart.
Additional features
The bullet chart also allows you to:
Customise the look and feel
You can customise the look and feel of the chart to match your organisation's branding. For more information about customisation, see the Configuration section.