
The Content Engagement section in the Engagement tab, shows your user's consumption of content, including the average number of engagements per content type, and a list of the most engaging items of content. This gives you an indication of which type of content users most frequently engage with.
The data displayed on the tables and charts are based on filters selected in the Filter By section.
The following insights are shown:
|
Insight |
Description |
|---|---|
|
Average Engagement per Content Item |
Shows the average engagement per item of content, broken down by content type, based on filters selected in the Filter By section. 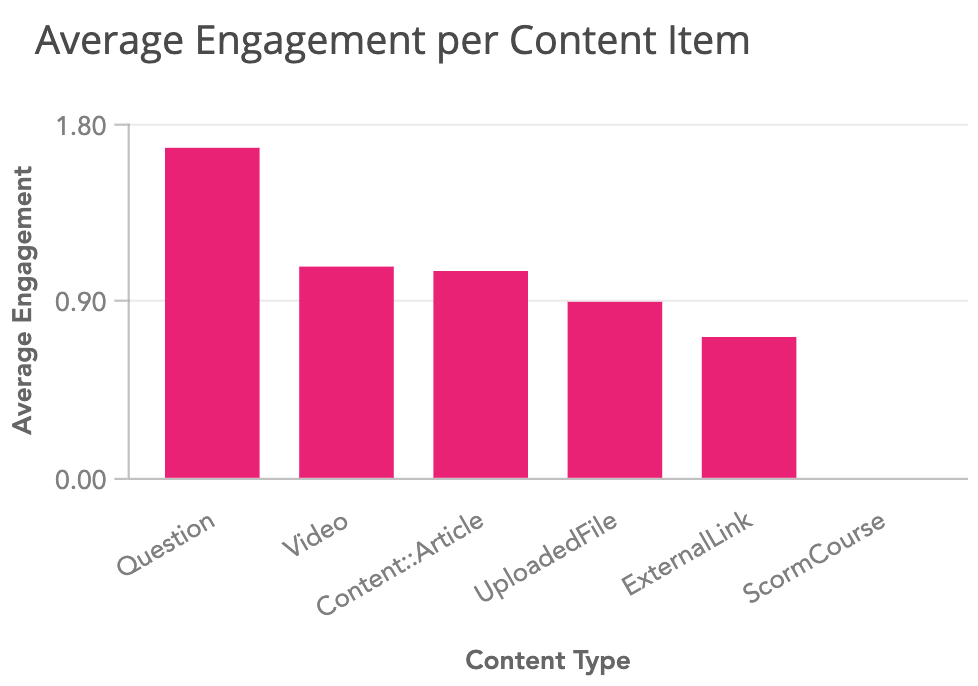
In the example below, the average engagement for video content in the Fuse instance is 1.07. Hover over each bar in the chart to see the details for a specific content type. 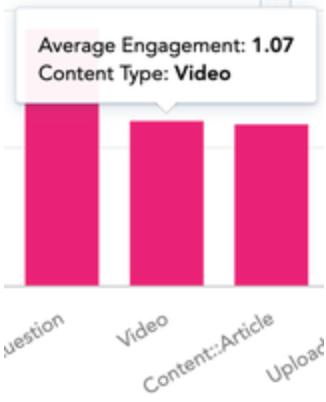
|
|
Most Engaging Content |
A list of content that has been engaged with the most, based on the number of engagements. 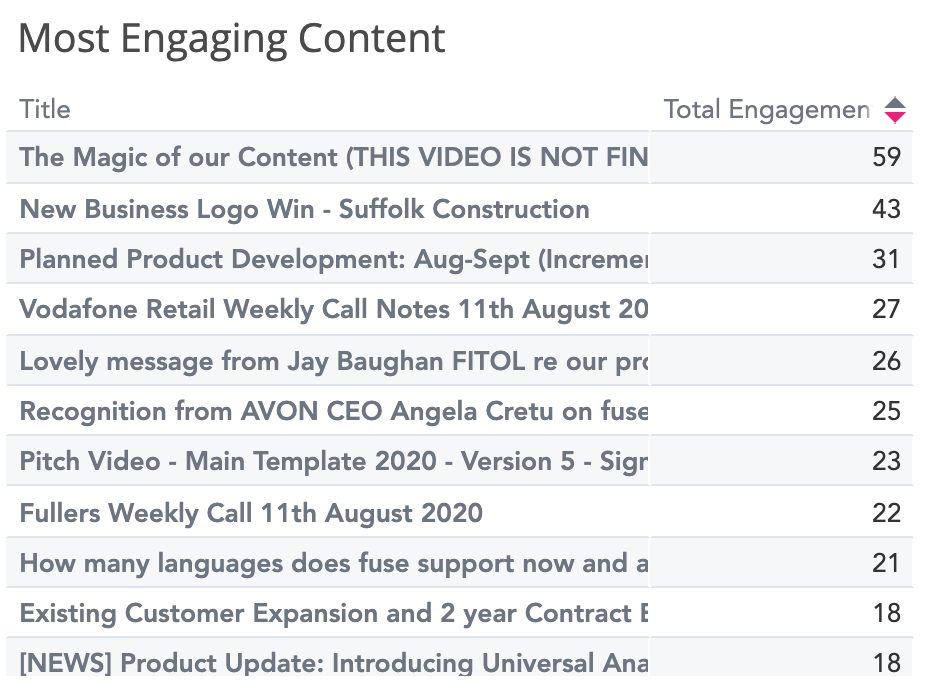
In the example below, the item of content with the highest level of engagement (likes, shares, views, comments, and follows) has 59 engagements in total. 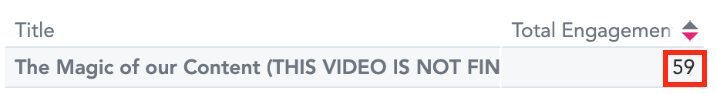
|